| Multiple Linear Regression - Estimated Regression Equation |
| USDOLLAR[t] = + 0.111935700362069 + 0.0182913192531364Amerikaanse_inflatie[t] + 1.05085697392121`Y[t-1]`[t] -0.205313543557759`Y[t-2]`[t] + 0.000281672269563672t + e[t] |
| Multiple Linear Regression - Ordinary Least Squares | |||||
| Variable | Parameter | S.D. | T-STAT H0: parameter = 0 | 2-tail p-value | 1-tail p-value |
| (Intercept) | 0.111935700362069 | 0.04581 | 2.4435 | 0.01812 | 0.00906 |
| Amerikaanse_inflatie | 0.0182913192531364 | 0.011845 | 1.5442 | 0.128849 | 0.064425 |
| `Y[t-1]` | 1.05085697392121 | 0.161194 | 6.5192 | 0 | 0 |
| `Y[t-2]` | -0.205313543557759 | 0.149834 | -1.3703 | 0.176724 | 0.088362 |
| t | 0.000281672269563672 | 0.000288 | 0.9795 | 0.332044 | 0.166022 |
| Multiple Linear Regression - Regression Statistics | |
| Multiple R | 0.924271488211047 |
| R-squared | 0.854277783919864 |
| Adjusted R-squared | 0.842620006633453 |
| F-TEST (value) | 73.2796452472692 |
| F-TEST (DF numerator) | 4 |
| F-TEST (DF denominator) | 50 |
| p-value | 0 |
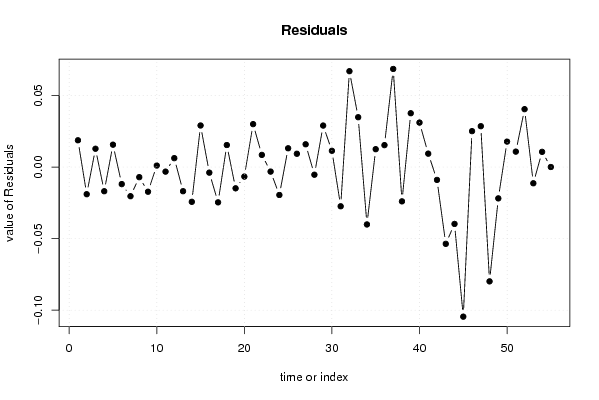
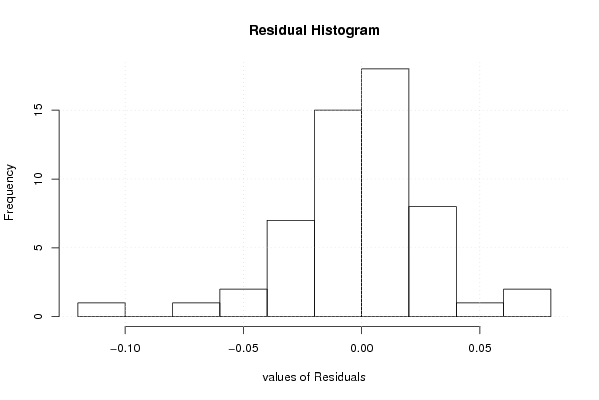
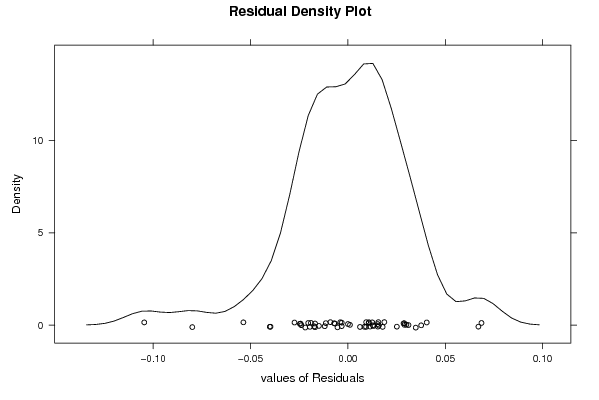
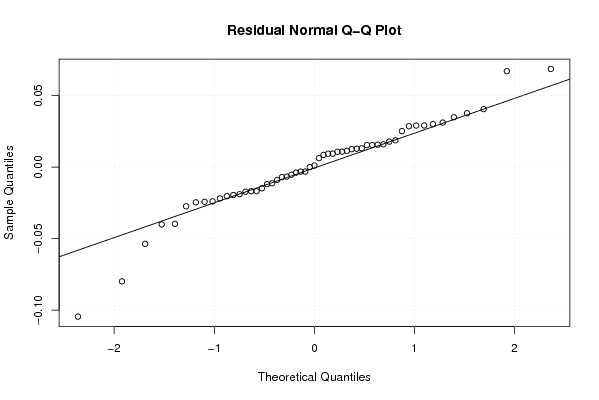
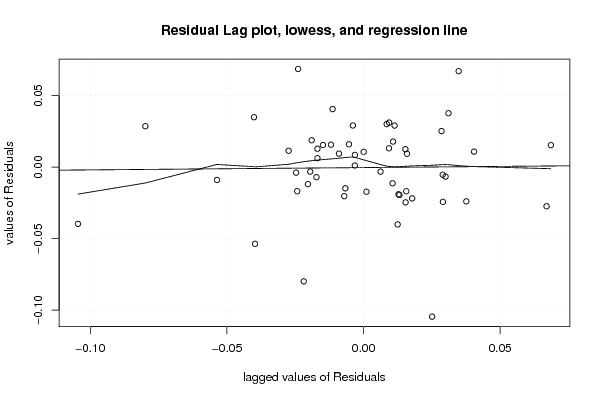
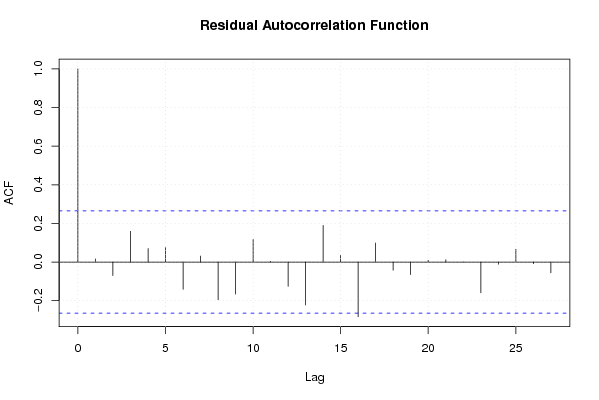
| Multiple Linear Regression - Residual Statistics | |
| Residual Standard Deviation | 0.0317330932234768 |
| Sum Squared Residuals | 0.0503494602764936 |
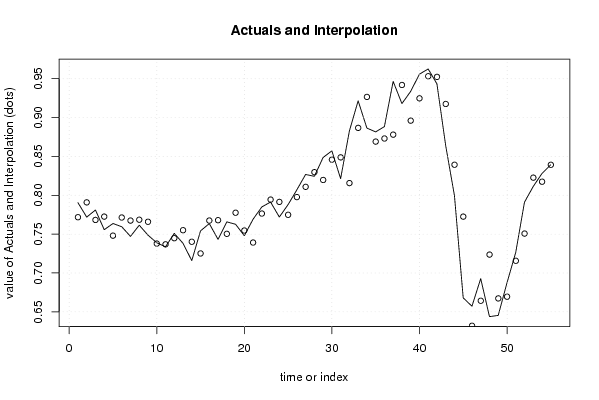
| Multiple Linear Regression - Actuals, Interpolation, and Residuals | |||
| Time or Index | Actuals | Interpolation Forecast | Residuals Prediction Error |
| 1 | 0.7905 | 0.771786945730956 | 0.0187130542690440 |
| 2 | 0.7719 | 0.790864714862925 | -0.0189647148629254 |
| 3 | 0.7811 | 0.768276608047022 | 0.0128233919529781 |
| 4 | 0.7557 | 0.77257009301371 | -0.0168700930137101 |
| 5 | 0.7637 | 0.748057416630343 | 0.0156425833696571 |
| 6 | 0.7595 | 0.771399229432262 | -0.0118992294322618 |
| 7 | 0.7471 | 0.767453925988208 | -0.0203539259882079 |
| 8 | 0.7615 | 0.768554125333818 | -0.00705412533381808 |
| 9 | 0.7487 | 0.765918000488932 | -0.0172180004889317 |
| 10 | 0.7389 | 0.737829665673521 | 0.00107033432647899 |
| 11 | 0.7337 | 0.7368794973333 | -0.0031794973333001 |
| 12 | 0.751 | 0.744775034213487 | 0.00622496578651287 |
| 13 | 0.7382 | 0.755067046335554 | -0.0168670463355542 |
| 14 | 0.7159 | 0.74017495696069 | -0.0242749569606907 |
| 15 | 0.7542 | 0.725137927845292 | 0.0290620721547083 |
| 16 | 0.7636 | 0.767483925030152 | -0.00388392503015215 |
| 17 | 0.7433 | 0.767951012210999 | -0.0246510122109993 |
| 18 | 0.7658 | 0.750402862418701 | 0.0153971375812990 |
| 19 | 0.7627 | 0.777545532934551 | -0.0148455329345513 |
| 20 | 0.748 | 0.754640159640035 | -0.00664015964003453 |
| 21 | 0.7692 | 0.739177849096075 | 0.0300221509039245 |
| 22 | 0.785 | 0.776498825263581 | 0.0085011747364186 |
| 23 | 0.7913 | 0.794445621096604 | -0.00314562109660412 |
| 24 | 0.772 | 0.791500572063277 | -0.0195005720632765 |
| 25 | 0.788 | 0.774871515821297 | 0.0131284841787032 |
| 26 | 0.807 | 0.797685417712566 | 0.00931458228743438 |
| 27 | 0.8268 | 0.810880344023562 | 0.0159196559764379 |
| 28 | 0.8244 | 0.829732537101204 | -0.00533253710120359 |
| 29 | 0.8487 | 0.819695515343273 | 0.0290044846567270 |
| 30 | 0.8572 | 0.84582285139113 | 0.0113771486088707 |
| 31 | 0.8214 | 0.848803879121356 | -0.0274038791213563 |
| 32 | 0.8827 | 0.815700968000076 | 0.0669990319999246 |
| 33 | 0.9216 | 0.886762666390708 | 0.0348373336092923 |
| 34 | 0.8865 | 0.926586116066395 | -0.0400861160663946 |
| 35 | 0.8816 | 0.869100631633466 | 0.0124993683665343 |
| 36 | 0.8884 | 0.873067537523222 | 0.0153324624767778 |
| 37 | 0.9466 | 0.878025722920787 | 0.068574277079213 |
| 38 | 0.918 | 0.941948898658037 | -0.0239488986580372 |
| 39 | 0.9337 | 0.896074683767931 | 0.0376253162320691 |
| 40 | 0.9559 | 0.92479949586585 | 0.0311005041341493 |
| 41 | 0.9626 | 0.953216659474735 | 0.0093833405252648 |
| 42 | 0.9434 | 0.952377722909721 | -0.00897772290972091 |
| 43 | 0.8639 | 0.917535181652333 | -0.0536351816523331 |
| 44 | 0.7996 | 0.839313223686658 | -0.0397132236866579 |
| 45 | 0.668 | 0.772525228091967 | -0.104525228091967 |
| 46 | 0.6572 | 0.632076705482831 | 0.0251232945171685 |
| 47 | 0.6928 | 0.664234493624526 | 0.0285655063754739 |
| 48 | 0.6438 | 0.723660898079205 | -0.079860898079205 |
| 49 | 0.6454 | 0.66728150082859 | -0.0218815008285904 |
| 50 | 0.6873 | 0.669482469451824 | 0.0178175305481762 |
| 51 | 0.7265 | 0.715698088207876 | 0.0108019117921236 |
| 52 | 0.7912 | 0.750729092051951 | 0.0404709079480485 |
| 53 | 0.8114 | 0.82271423790652 | -0.0113142379065199 |
| 54 | 0.8281 | 0.817458732491543 | 0.0106412675084565 |
| 55 | 0.8393 | 0.839245437074864 | 5.45629251361077e-05 |
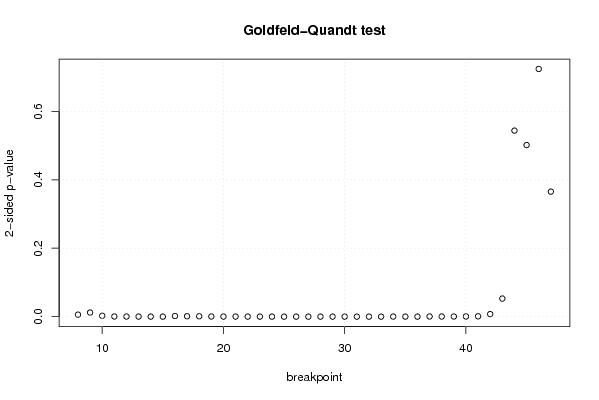
| Goldfeld-Quandt test for Heteroskedasticity | |||
| p-values | Alternative Hypothesis | ||
| breakpoint index | greater | 2-sided | less |
| 8 | 0.00292014863661846 | 0.00584029727323691 | 0.997079851363382 |
| 9 | 0.00601524298895622 | 0.0120304859779124 | 0.993984757011044 |
| 10 | 0.00129259332101904 | 0.00258518664203808 | 0.99870740667898 |
| 11 | 0.000260022456611605 | 0.000520044913223211 | 0.999739977543388 |
| 12 | 0.000184354005669952 | 0.000368708011339903 | 0.99981564599433 |
| 13 | 0.000114113469553773 | 0.000228226939107545 | 0.999885886530446 |
| 14 | 3.75948640625916e-05 | 7.51897281251832e-05 | 0.999962405135937 |
| 15 | 6.59619591920553e-05 | 0.000131923918384111 | 0.999934038040808 |
| 16 | 0.000913499898764166 | 0.00182699979752833 | 0.999086500101236 |
| 17 | 0.000543927068423557 | 0.00108785413684711 | 0.999456072931576 |
| 18 | 0.000543319597212376 | 0.00108663919442475 | 0.999456680402788 |
| 19 | 0.000251251456803674 | 0.000502502913607348 | 0.999748748543196 |
| 20 | 9.7170494400496e-05 | 0.000194340988800992 | 0.9999028295056 |
| 21 | 0.000121900428489044 | 0.000243800856978087 | 0.999878099571511 |
| 22 | 9.60531530960808e-05 | 0.000192106306192162 | 0.999903946846904 |
| 23 | 3.69625055449042e-05 | 7.39250110898084e-05 | 0.999963037494455 |
| 24 | 2.81546867707756e-05 | 5.63093735415511e-05 | 0.999971845313229 |
| 25 | 1.02041602877537e-05 | 2.04083205755075e-05 | 0.999989795839712 |
| 26 | 5.96968606940429e-06 | 1.19393721388086e-05 | 0.99999403031393 |
| 27 | 4.0002148869588e-06 | 8.0004297739176e-06 | 0.999995999785113 |
| 28 | 1.64106479442602e-06 | 3.28212958885205e-06 | 0.999998358935206 |
| 29 | 8.1752653745584e-07 | 1.63505307491168e-06 | 0.999999182473463 |
| 30 | 2.83704112820456e-07 | 5.67408225640912e-07 | 0.999999716295887 |
| 31 | 1.86515285208087e-06 | 3.73030570416173e-06 | 0.999998134847148 |
| 32 | 5.82415558789093e-06 | 1.16483111757819e-05 | 0.999994175844412 |
| 33 | 2.31356658958941e-05 | 4.62713317917883e-05 | 0.999976864334104 |
| 34 | 0.00011154118668687 | 0.00022308237337374 | 0.999888458813313 |
| 35 | 6.05805119773678e-05 | 0.000121161023954736 | 0.999939419488023 |
| 36 | 2.43840497138314e-05 | 4.87680994276628e-05 | 0.999975615950286 |
| 37 | 0.000260013765089429 | 0.000520027530178858 | 0.99973998623491 |
| 38 | 0.000179275924111041 | 0.000358551848222082 | 0.999820724075889 |
| 39 | 0.000197747831133697 | 0.000395495662267394 | 0.999802252168866 |
| 40 | 0.000286569783096201 | 0.000573139566192401 | 0.999713430216904 |
| 41 | 0.000494055700118796 | 0.000988111400237591 | 0.999505944299881 |
| 42 | 0.00370775363525324 | 0.00741550727050648 | 0.996292246364747 |
| 43 | 0.0264369237469829 | 0.0528738474939658 | 0.973563076253017 |
| 44 | 0.728132274565953 | 0.543735450868094 | 0.271867725434047 |
| 45 | 0.749234982229061 | 0.501530035541878 | 0.250765017770939 |
| 46 | 0.637998077966581 | 0.724003844066838 | 0.362001922033419 |
| 47 | 0.817284563729866 | 0.365430872540268 | 0.182715436270134 |
| Meta Analysis of Goldfeld-Quandt test for Heteroskedasticity | |||
| Description | # significant tests | % significant tests | OK/NOK |
| 1% type I error level | 34 | 0.85 | NOK |
| 5% type I error level | 35 | 0.875 | NOK |
| 10% type I error level | 36 | 0.9 | NOK |