| Multiple Linear Regression - Estimated Regression Equation |
| TotProd[t] = + 68.9998726894388 + 0.272276741690668ProdMetal[t] -0.843105051703042M1[t] -0.0138936993450399M2[t] + 8.0629457216336M3[t] + 2.83037297108659M4[t] + 2.17532426340796M5[t] + 8.43384670689379M6[t] -9.94021868678311M7[t] -2.35189545873824M8[t] + 8.71128351209637M9[t] + 9.1395056597435M10[t] + 4.37415861979585M11[t] + 0.088907391478745t + e[t] |
| Multiple Linear Regression - Ordinary Least Squares | |||||
| Variable | Parameter | S.D. | T-STAT H0: parameter = 0 | 2-tail p-value | 1-tail p-value |
| (Intercept) | 68.9998726894388 | 8.871394 | 7.7778 | 0 | 0 |
| ProdMetal | 0.272276741690668 | 0.092205 | 2.953 | 0.004944 | 0.002472 |
| M1 | -0.843105051703042 | 2.033966 | -0.4145 | 0.680425 | 0.340213 |
| M2 | -0.0138936993450399 | 2.030811 | -0.0068 | 0.994571 | 0.497285 |
| M3 | 8.0629457216336 | 2.327675 | 3.4639 | 0.001163 | 0.000581 |
| M4 | 2.83037297108659 | 2.158227 | 1.3114 | 0.19622 | 0.09811 |
| M5 | 2.17532426340796 | 2.014348 | 1.0799 | 0.28581 | 0.142905 |
| M6 | 8.43384670689379 | 2.282024 | 3.6958 | 0.000582 | 0.000291 |
| M7 | -9.94021868678311 | 2.088901 | -4.7586 | 2e-05 | 1e-05 |
| M8 | -2.35189545873824 | 1.983136 | -1.1859 | 0.241733 | 0.120866 |
| M9 | 8.71128351209637 | 2.352284 | 3.7033 | 0.000569 | 0.000284 |
| M10 | 9.1395056597435 | 2.446804 | 3.7353 | 0.000516 | 0.000258 |
| M11 | 4.37415861979585 | 2.095697 | 2.0872 | 0.042438 | 0.021219 |
| t | 0.088907391478745 | 0.026525 | 3.3518 | 0.001613 | 0.000806 |
| Multiple Linear Regression - Regression Statistics | |
| Multiple R | 0.937242633290538 |
| R-squared | 0.878423753657381 |
| Adjusted R-squared | 0.844065249256206 |
| F-TEST (value) | 25.5664141663670 |
| F-TEST (DF numerator) | 13 |
| F-TEST (DF denominator) | 46 |
| p-value | 1.11022302462516e-16 |
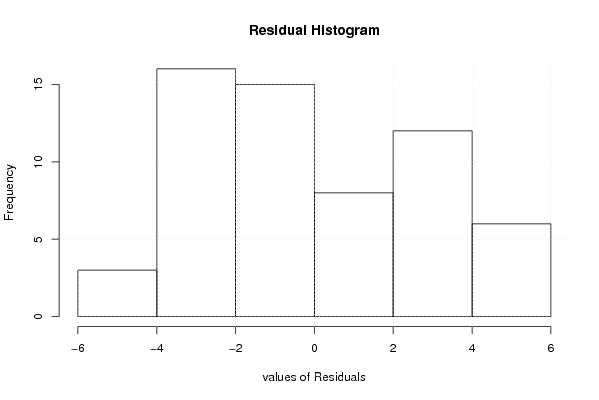
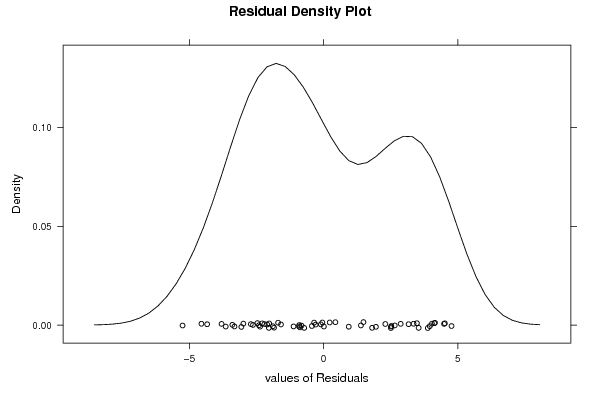
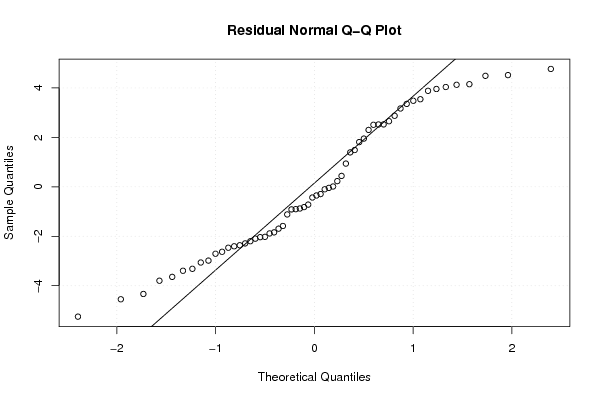
| Multiple Linear Regression - Residual Statistics | |
| Residual Standard Deviation | 3.12812386152141 |
| Sum Squared Residuals | 450.117309078901 |
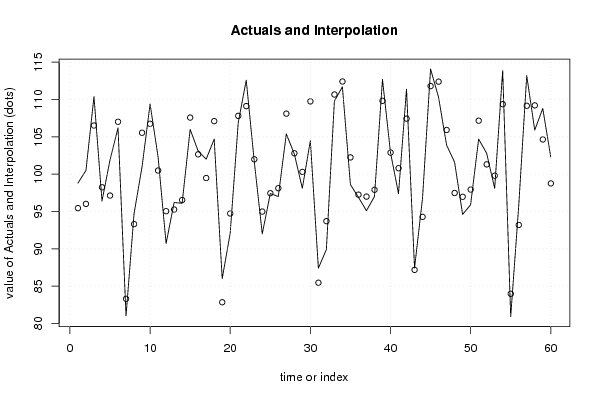
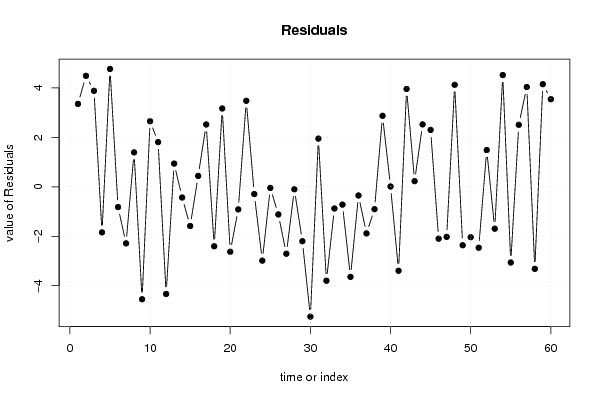
| Multiple Linear Regression - Actuals, Interpolation, and Residuals | |||
| Time or Index | Actuals | Interpolation Forecast | Residuals Prediction Error |
| 1 | 98.8 | 95.4461215241126 | 3.35387847588742 |
| 2 | 100.5 | 96.0102805037512 | 4.4897194962488 |
| 3 | 110.4 | 106.517607294748 | 3.88239270525169 |
| 4 | 96.4 | 98.2427594062374 | -1.84275940623736 |
| 5 | 101.9 | 97.1320646066561 | 4.76793539334386 |
| 6 | 106.2 | 107.019092083599 | -0.81909208359941 |
| 7 | 81 | 83.2883992475879 | -2.28839924758789 |
| 8 | 94.7 | 93.3072098456512 | 1.39279015434875 |
| 9 | 101 | 105.548403174727 | -4.54840317472728 |
| 10 | 109.4 | 106.746224568080 | 2.65377543192018 |
| 11 | 102.3 | 100.490579817805 | 1.80942018219495 |
| 12 | 90.7 | 95.034538600218 | -4.33453860021807 |
| 13 | 96.2 | 95.2605372100802 | 0.93946278991982 |
| 14 | 96.1 | 96.5326157181148 | -0.432615718114795 |
| 15 | 106 | 107.584495992493 | -1.58449599249326 |
| 16 | 103.1 | 102.658652026778 | 0.441347973222465 |
| 17 | 102 | 99.4786539903472 | 2.52134600965277 |
| 18 | 104.7 | 107.105784511258 | -2.40578451125794 |
| 19 | 86 | 82.8305381918651 | 3.16946180813492 |
| 20 | 92.1 | 94.728058307594 | -2.62805830759406 |
| 21 | 106.9 | 107.813309535911 | -0.913309535911158 |
| 22 | 112.6 | 109.12004162594 | 3.47995837406003 |
| 23 | 101.7 | 101.993111302255 | -0.293111302255055 |
| 24 | 92 | 94.9850926570313 | -2.98509265703126 |
| 25 | 97.4 | 97.4437605487569 | -0.0437605487568535 |
| 26 | 97 | 98.116830225072 | -1.11683022507200 |
| 27 | 105.4 | 108.106831206857 | -2.70683120685685 |
| 28 | 102.7 | 102.799799802774 | -0.0997998027741924 |
| 29 | 98.1 | 100.300493620571 | -2.20049362057057 |
| 30 | 104.5 | 109.751878310809 | -5.25187831080876 |
| 31 | 87.4 | 85.4494043172468 | 1.95059568275317 |
| 32 | 89.9 | 93.6984160943208 | -3.79841609432085 |
| 33 | 109.8 | 110.677224728815 | -0.87722472881452 |
| 34 | 111.7 | 112.419599605548 | -0.719599605548383 |
| 35 | 98.6 | 102.243169774928 | -3.643169774928 |
| 36 | 96.9 | 97.2499990182151 | -0.349999018215143 |
| 37 | 95.1 | 96.985899493034 | -1.88589949303406 |
| 38 | 97 | 97.9040182368708 | -0.904018236870802 |
| 39 | 112.7 | 109.827184084659 | 2.8728159153406 |
| 40 | 102.9 | 102.886492230433 | 0.0135077695672743 |
| 41 | 97.4 | 100.795601160765 | -3.39560116076510 |
| 42 | 111.4 | 107.442535411589 | 3.9574645884106 |
| 43 | 87.4 | 87.1697571950494 | 0.230242804950623 |
| 44 | 96.8 | 94.2752066570226 | 2.52479334297741 |
| 45 | 114.1 | 111.798568774898 | 2.3014312251024 |
| 46 | 110.3 | 112.397381336531 | -2.09738133653066 |
| 47 | 103.9 | 105.923915192903 | -2.02391519290335 |
| 48 | 101.6 | 97.472829816719 | 4.12717018328098 |
| 49 | 94.6 | 96.9636812240163 | -2.36368122401633 |
| 50 | 95.9 | 97.9362553161912 | -2.0362553161912 |
| 51 | 104.7 | 107.163881421242 | -2.46388142124219 |
| 52 | 102.8 | 101.312296533778 | 1.48770346622181 |
| 53 | 98.1 | 99.793186621661 | -1.69318662166097 |
| 54 | 113.9 | 109.380709682744 | 4.51929031725551 |
| 55 | 80.9 | 83.9619010482508 | -3.06190104825082 |
| 56 | 95.7 | 93.1911090954112 | 2.50889090458875 |
| 57 | 113.2 | 109.162493785649 | 4.03750621435056 |
| 58 | 105.9 | 109.216752863901 | -3.31675286390117 |
| 59 | 108.8 | 104.649223912109 | 4.15077608789145 |
| 60 | 102.3 | 98.7575399078165 | 3.5424600921835 |
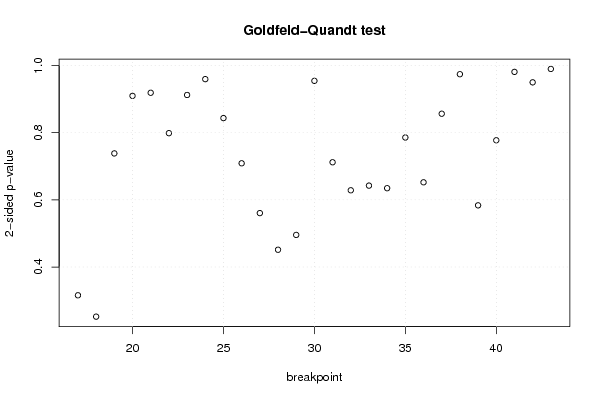
| Goldfeld-Quandt test for Heteroskedasticity | |||
| p-values | Alternative Hypothesis | ||
| breakpoint index | greater | 2-sided | less |
| 17 | 0.157966862556138 | 0.315933725112277 | 0.842033137443862 |
| 18 | 0.126174460787153 | 0.252348921574307 | 0.873825539212847 |
| 19 | 0.630897981504623 | 0.738204036990754 | 0.369102018495377 |
| 20 | 0.545280184278947 | 0.909439631442106 | 0.454719815721053 |
| 21 | 0.540647147513094 | 0.918705704973811 | 0.459352852486906 |
| 22 | 0.600787709039201 | 0.798424581921598 | 0.399212290960799 |
| 23 | 0.543943750433120 | 0.91211249913376 | 0.45605624956688 |
| 24 | 0.479612826693043 | 0.959225653386087 | 0.520387173306956 |
| 25 | 0.421659004518302 | 0.843318009036603 | 0.578340995481698 |
| 26 | 0.354392604218404 | 0.708785208436808 | 0.645607395781596 |
| 27 | 0.280286169854181 | 0.560572339708363 | 0.719713830145819 |
| 28 | 0.225736145335122 | 0.451472290670244 | 0.774263854664878 |
| 29 | 0.247792537761854 | 0.495585075523709 | 0.752207462238146 |
| 30 | 0.477092483165208 | 0.954184966330415 | 0.522907516834792 |
| 31 | 0.644080174041965 | 0.71183965191607 | 0.355919825958035 |
| 32 | 0.685790349687403 | 0.628419300625193 | 0.314209650312597 |
| 33 | 0.67882380043482 | 0.64235239913036 | 0.32117619956518 |
| 34 | 0.682683854734029 | 0.634632290531942 | 0.317316145265971 |
| 35 | 0.607225033224068 | 0.785549933551864 | 0.392774966775932 |
| 36 | 0.67389312331339 | 0.652213753373219 | 0.326106876686610 |
| 37 | 0.571839423725043 | 0.856321152549914 | 0.428160576274957 |
| 38 | 0.486959338478045 | 0.97391867695609 | 0.513040661521955 |
| 39 | 0.70818286467156 | 0.58363427065688 | 0.29181713532844 |
| 40 | 0.611361172558048 | 0.777277654883904 | 0.388638827441952 |
| 41 | 0.509556546380737 | 0.980886907238525 | 0.490443453619263 |
| 42 | 0.52512394561262 | 0.94975210877476 | 0.47487605438738 |
| 43 | 0.505214681236331 | 0.989570637527338 | 0.494785318763669 |
| Meta Analysis of Goldfeld-Quandt test for Heteroskedasticity | |||
| Description | # significant tests | % significant tests | OK/NOK |
| 1% type I error level | 0 | 0 | OK |
| 5% type I error level | 0 | 0 | OK |
| 10% type I error level | 0 | 0 | OK |