| Multiple Linear Regression - Estimated Regression Equation |
| Y[t] = + 95.4128864396907 -0.373522045942315`Y(t-1)`[t] -0.0751593337637079`Y(t-2)`[t] + 0.35885170198808`Y(t-3)`[t] -0.0788126508587618`Y(t-4)`[t] + 0.240211501967378X[t] -2.86774271905553M1[t] -1.32952280976387M2[t] -14.2114323871744M3[t] -14.3746263866844M4[t] -4.43378811719101M5[t] + 11.5304356672672M6[t] + 2.77911200658021M7[t] -9.08766106143715M8[t] -13.6044063583265M9[t] -9.75894265732346M10[t] + 0.542826991949121M11[t] + 0.118834153023582t + e[t] |
| Multiple Linear Regression - Ordinary Least Squares | |||||
| Variable | Parameter | S.D. | T-STAT H0: parameter = 0 | 2-tail p-value | 1-tail p-value |
| (Intercept) | 95.4128864396907 | 29.571546 | 3.2265 | 0.00258 | 0.00129 |
| `Y(t-1)` | -0.373522045942315 | 0.152926 | -2.4425 | 0.019347 | 0.009674 |
| `Y(t-2)` | -0.0751593337637079 | 0.143199 | -0.5249 | 0.60273 | 0.301365 |
| `Y(t-3)` | 0.35885170198808 | 0.13368 | 2.6844 | 0.010706 | 0.005353 |
| `Y(t-4)` | -0.0788126508587618 | 0.140797 | -0.5598 | 0.578927 | 0.289464 |
| X | 0.240211501967378 | 0.083725 | 2.869 | 0.006688 | 0.003344 |
| M1 | -2.86774271905553 | 2.432236 | -1.1791 | 0.245706 | 0.122853 |
| M2 | -1.32952280976387 | 2.729066 | -0.4872 | 0.628936 | 0.314468 |
| M3 | -14.2114323871744 | 2.997538 | -4.741 | 3e-05 | 1.5e-05 |
| M4 | -14.3746263866844 | 3.897917 | -3.6878 | 0.000705 | 0.000352 |
| M5 | -4.43378811719101 | 3.968807 | -1.1172 | 0.27094 | 0.13547 |
| M6 | 11.5304356672672 | 2.95942 | 3.8962 | 0.000384 | 0.000192 |
| M7 | 2.77911200658021 | 3.337615 | 0.8327 | 0.410237 | 0.205119 |
| M8 | -9.08766106143715 | 3.568795 | -2.5464 | 0.015058 | 0.007529 |
| M9 | -13.6044063583265 | 4.064238 | -3.3473 | 0.001849 | 0.000924 |
| M10 | -9.75894265732346 | 3.861444 | -2.5273 | 0.015776 | 0.007888 |
| M11 | 0.542826991949121 | 2.913759 | 0.1863 | 0.853202 | 0.426601 |
| t | 0.118834153023582 | 0.032118 | 3.6999 | 0.00068 | 0.00034 |
| Multiple Linear Regression - Regression Statistics | |
| Multiple R | 0.965222670470673 |
| R-squared | 0.931654803590538 |
| Adjusted R-squared | 0.901079320986305 |
| F-TEST (value) | 30.4706491684797 |
| F-TEST (DF numerator) | 17 |
| F-TEST (DF denominator) | 38 |
| p-value | 0 |
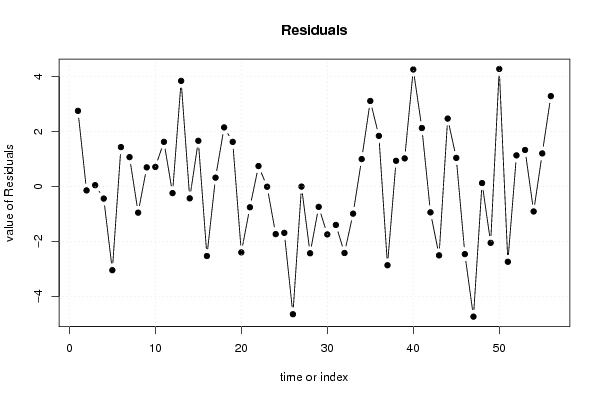
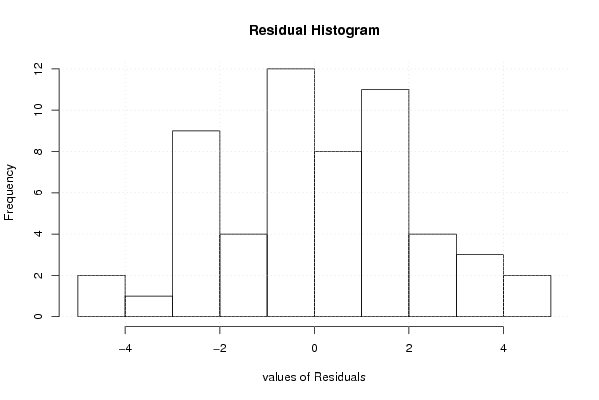
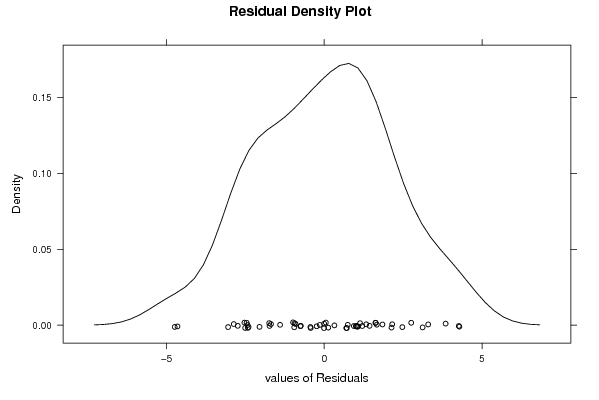
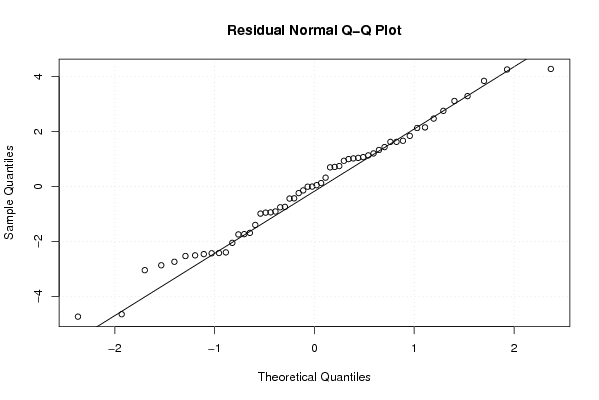
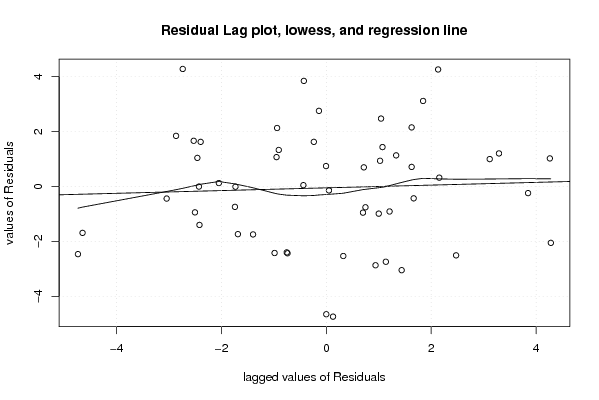
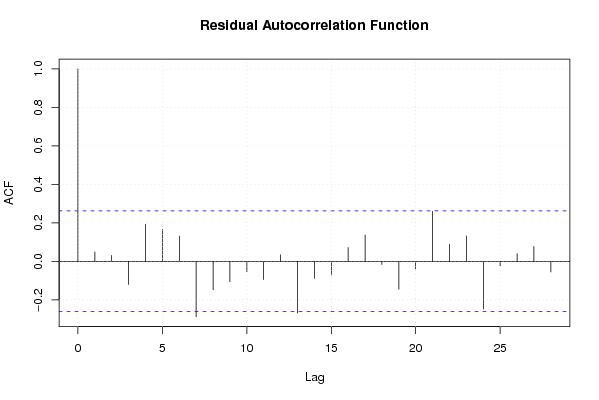
| Multiple Linear Regression - Residual Statistics | |
| Residual Standard Deviation | 2.53947701998751 |
| Sum Squared Residuals | 245.059854331697 |
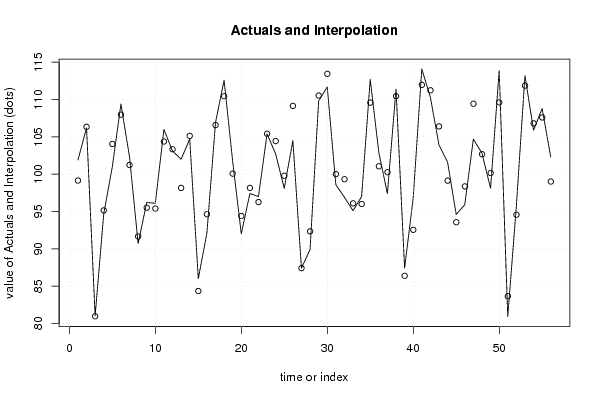
| Multiple Linear Regression - Actuals, Interpolation, and Residuals | |||
| Time or Index | Actuals | Interpolation Forecast | Residuals Prediction Error |
| 1 | 101.9 | 99.1445860766064 | 2.75541392339363 |
| 2 | 106.2 | 106.340899427729 | -0.140899427728557 |
| 3 | 81 | 80.9499037594068 | 0.0500962405931573 |
| 4 | 94.7 | 95.1379947253594 | -0.437994725359363 |
| 5 | 101 | 104.044869076007 | -3.04486907600714 |
| 6 | 109.4 | 107.963626717616 | 1.43637328238427 |
| 7 | 102.3 | 101.229168628792 | 1.07083137120781 |
| 8 | 90.7 | 91.6500207836738 | -0.950020783673838 |
| 9 | 96.2 | 95.5011926458335 | 0.698807354166547 |
| 10 | 96.1 | 95.385369120065 | 0.714630879934984 |
| 11 | 106 | 104.373080790145 | 1.62691920985529 |
| 12 | 103.1 | 103.338815942237 | -0.238815942236608 |
| 13 | 102 | 98.1536587363678 | 3.84634126363217 |
| 14 | 104.7 | 105.129056291149 | -0.429056291148919 |
| 15 | 86 | 84.3345783873083 | 1.66542161269171 |
| 16 | 92.1 | 94.629248694579 | -2.52924869457905 |
| 17 | 106.9 | 106.577011353510 | 0.322988646489924 |
| 18 | 112.6 | 110.446763446297 | 2.15323655370333 |
| 19 | 101.7 | 100.073728572539 | 1.62627142746112 |
| 20 | 92 | 94.3969047553746 | -2.39690475537456 |
| 21 | 97.4 | 98.1549173870111 | -0.754917387011089 |
| 22 | 97 | 96.2543357171215 | 0.745664282878467 |
| 23 | 105.4 | 105.406101383728 | -0.0061013837281591 |
| 24 | 102.7 | 104.432742095278 | -1.73274209527785 |
| 25 | 98.1 | 99.786373990274 | -1.68637399027409 |
| 26 | 104.5 | 109.148850144557 | -4.64885014455749 |
| 27 | 87.4 | 87.4013665053923 | -0.00136650539228322 |
| 28 | 89.9 | 92.3297343907367 | -2.42973439073671 |
| 29 | 109.8 | 110.540541534533 | -0.740541534533216 |
| 30 | 111.7 | 113.442799112715 | -1.74279911271466 |
| 31 | 98.6 | 99.997500220777 | -1.39750022077703 |
| 32 | 96.9 | 99.3194647107772 | -2.41946471077723 |
| 33 | 95.1 | 96.0869555025472 | -0.986955502547245 |
| 34 | 97 | 96.0006625739928 | 0.99933742600716 |
| 35 | 112.7 | 109.584177849793 | 3.11582215020686 |
| 36 | 102.9 | 101.055738685319 | 1.84426131468113 |
| 37 | 97.4 | 100.265841223737 | -2.8658412237372 |
| 38 | 111.4 | 110.462288346365 | 0.937711653635157 |
| 39 | 87.4 | 86.3756313521583 | 1.02436864784174 |
| 40 | 96.8 | 92.5378053989454 | 4.26219460105456 |
| 41 | 114.1 | 111.968537153527 | 2.13146284647340 |
| 42 | 110.3 | 111.239411449681 | -0.939411449681161 |
| 43 | 103.9 | 106.405362948800 | -2.50536294879989 |
| 44 | 101.6 | 99.1256301423596 | 2.47436985764043 |
| 45 | 94.6 | 93.5569344646082 | 1.04306553539179 |
| 46 | 95.9 | 98.3596325888206 | -2.45963258882062 |
| 47 | 104.7 | 109.436639976334 | -4.73663997633399 |
| 48 | 102.8 | 102.672703277167 | 0.127296722833328 |
| 49 | 98.1 | 100.149539973015 | -2.04953997301452 |
| 50 | 113.9 | 109.618905790200 | 4.28109420979980 |
| 51 | 80.9 | 83.6385199957343 | -2.73851999573432 |
| 52 | 95.7 | 94.5652167903794 | 1.13478320962056 |
| 53 | 113.2 | 111.869040882423 | 1.33095911757704 |
| 54 | 105.9 | 106.807399273692 | -0.907399273691782 |
| 55 | 108.8 | 107.594239629092 | 1.20576037090798 |
| 56 | 102.3 | 99.0079796078148 | 3.2920203921852 |
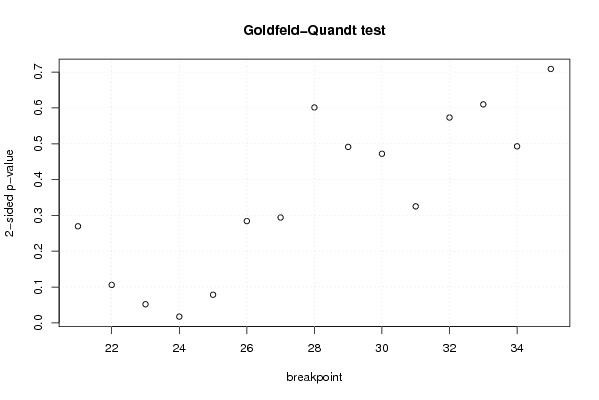
| Goldfeld-Quandt test for Heteroskedasticity | |||
| p-values | Alternative Hypothesis | ||
| breakpoint index | greater | 2-sided | less |
| 21 | 0.134811766897739 | 0.269623533795478 | 0.865188233102261 |
| 22 | 0.0530113740785981 | 0.106022748157196 | 0.946988625921402 |
| 23 | 0.0259960279399008 | 0.0519920558798016 | 0.9740039720601 |
| 24 | 0.00869164270676587 | 0.0173832854135317 | 0.991308357293234 |
| 25 | 0.0392743555387186 | 0.0785487110774372 | 0.960725644461281 |
| 26 | 0.142077264177300 | 0.284154528354600 | 0.8579227358227 |
| 27 | 0.147039787979451 | 0.294079575958902 | 0.85296021202055 |
| 28 | 0.300637984065727 | 0.601275968131454 | 0.699362015934273 |
| 29 | 0.245606992646674 | 0.491213985293347 | 0.754393007353326 |
| 30 | 0.236046778514818 | 0.472093557029636 | 0.763953221485182 |
| 31 | 0.162639601423131 | 0.325279202846262 | 0.83736039857687 |
| 32 | 0.286608429185301 | 0.573216858370602 | 0.713391570814699 |
| 33 | 0.695066113110858 | 0.609867773778284 | 0.304933886889142 |
| 34 | 0.753568750524416 | 0.492862498951167 | 0.246431249475584 |
| 35 | 0.645597182373599 | 0.708805635252802 | 0.354402817626401 |
| Meta Analysis of Goldfeld-Quandt test for Heteroskedasticity | |||
| Description | # significant tests | % significant tests | OK/NOK |
| 1% type I error level | 0 | 0 | OK |
| 5% type I error level | 1 | 0.0666666666666667 | NOK |
| 10% type I error level | 3 | 0.2 | NOK |