| Multiple Linear Regression - Estimated Regression Equation |
| dzcg [t] = + 69.7953336755647 + 0.306108829568788indcvtr[t] + 0.273448408624239M1[t] + 0.95116889117043M2[t] + 1.01422818275155M3[t] + 2.85651745379877M4[t] + 1.83224614989734M5[t] + 1.6765272073922M6[t] + 2.6171429671458M7[t] + 2.24508932238194M8[t] + 1.45570918891171M9[t] -2.10878798767967M10[t] -0.83244840862423M11[t] -0.179393993839836t + e[t] |
| Multiple Linear Regression - Ordinary Least Squares | |||||
| Variable | Parameter | S.D. | T-STAT H0: parameter = 0 | 2-tail p-value | 1-tail p-value |
| (Intercept) | 69.7953336755647 | 3.065008 | 22.7717 | 0 | 0 |
| indcvtr | 0.306108829568788 | 0.08601 | 3.559 | 0.00094 | 0.00047 |
| M1 | 0.273448408624239 | 2.676107 | 0.1022 | 0.919099 | 0.459549 |
| M2 | 0.95116889117043 | 2.687255 | 0.354 | 0.725143 | 0.362571 |
| M3 | 1.01422818275155 | 2.689356 | 0.3771 | 0.707978 | 0.353989 |
| M4 | 2.85651745379877 | 2.671968 | 1.0691 | 0.291145 | 0.145572 |
| M5 | 1.83224614989734 | 2.67121 | 0.6859 | 0.49653 | 0.248265 |
| M6 | 1.6765272073922 | 2.670928 | 0.6277 | 0.533602 | 0.266801 |
| M7 | 2.6171429671458 | 2.671129 | 0.9798 | 0.332801 | 0.1664 |
| M8 | 2.24508932238194 | 2.674509 | 0.8394 | 0.405975 | 0.202988 |
| M9 | 1.45570918891171 | 2.817258 | 0.5167 | 0.608068 | 0.304034 |
| M10 | -2.10878798767967 | 2.816324 | -0.7488 | 0.458167 | 0.229084 |
| M11 | -0.83244840862423 | 2.815622 | -0.2957 | 0.768952 | 0.384476 |
| t | -0.179393993839836 | 0.037708 | -4.7574 | 2.3e-05 | 1.2e-05 |
| Multiple Linear Regression - Regression Statistics | |
| Multiple R | 0.794895346236096 |
| R-squared | 0.631858611467803 |
| Adjusted R-squared | 0.517910086445933 |
| F-TEST (value) | 5.54512321547408 |
| F-TEST (DF numerator) | 13 |
| F-TEST (DF denominator) | 42 |
| p-value | 1.01696678999064e-05 |
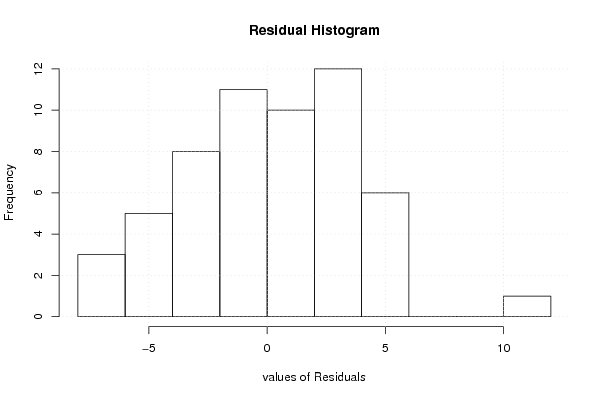
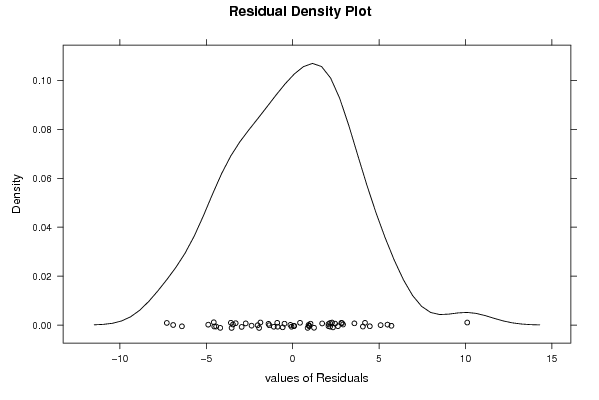
| Multiple Linear Regression - Residual Statistics | |
| Residual Standard Deviation | 3.98145592962503 |
| Sum Squared Residuals | 665.783635420945 |
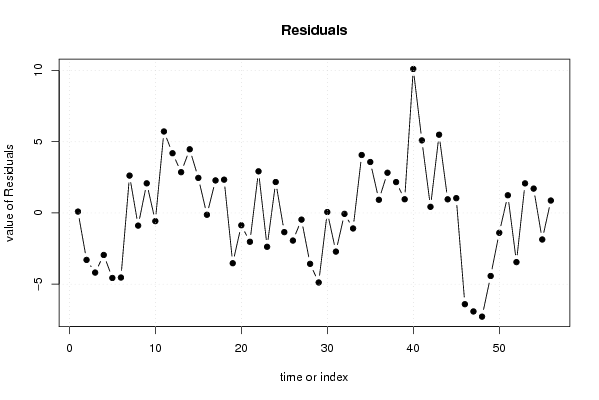
| Multiple Linear Regression - Actuals, Interpolation, and Residuals | |||
| Time or Index | Actuals | Interpolation Forecast | Residuals Prediction Error |
| 1 | 75.8 | 75.705455852156 | 0.0945441478439736 |
| 2 | 72.6 | 75.8976735112936 | -3.29767351129364 |
| 3 | 71.9 | 76.0874476386037 | -4.18744763860369 |
| 4 | 74.8 | 77.7503429158111 | -2.9503429158111 |
| 5 | 72.9 | 77.4650041067762 | -4.56500410677618 |
| 6 | 72.9 | 77.436 | -4.5360 |
| 7 | 79.9 | 77.2788952772074 | 2.62110472279261 |
| 8 | 74 | 74.890794661191 | -0.890794661190969 |
| 9 | 76 | 73.9220205338809 | 2.07797946611909 |
| 10 | 69.6 | 70.1781293634497 | -0.578129363449698 |
| 11 | 77.3 | 71.5811837782341 | 5.71881622176591 |
| 12 | 75.2 | 71.0098028747433 | 4.19019712525667 |
| 13 | 75.8 | 72.9405102669405 | 2.85948973305954 |
| 14 | 77.6 | 73.132727926078 | 4.46727207392197 |
| 15 | 76.7 | 74.2408285420945 | 2.45917145790554 |
| 16 | 77 | 77.128159137577 | -0.128159137577004 |
| 17 | 77.9 | 75.618385010267 | 2.28161498973306 |
| 18 | 76.7 | 74.3649455852156 | 2.33505441478440 |
| 19 | 71.9 | 75.4322761806982 | -3.53227618069815 |
| 20 | 73.4 | 74.2686108829569 | -0.868610882956876 |
| 21 | 72.5 | 74.524272073922 | -2.02427207392197 |
| 22 | 73.7 | 70.7803809034908 | 2.91961909650924 |
| 23 | 69.5 | 71.8773264887064 | -2.37732648870636 |
| 24 | 74.7 | 72.5303809034908 | 2.16961909650925 |
| 25 | 72.5 | 73.8488706365503 | -1.34887063655031 |
| 26 | 72.1 | 74.0410882956879 | -1.94108829568789 |
| 27 | 70.7 | 71.16977412731 | -0.469774127310062 |
| 28 | 71.4 | 74.975431211499 | -3.57543121149897 |
| 29 | 69.5 | 74.3839835728953 | -4.88398357289528 |
| 30 | 73.5 | 73.4366529774127 | 0.0633470225872678 |
| 31 | 72.4 | 75.1162012320329 | -2.71620123203285 |
| 32 | 74.5 | 74.5647535934292 | -0.0647535934291621 |
| 33 | 72.2 | 73.2898706365503 | -1.08987063655031 |
| 34 | 73 | 68.9337618069815 | 4.06623819301848 |
| 35 | 73.3 | 69.7245985626283 | 3.57540143737166 |
| 36 | 71.3 | 70.3776529774127 | 0.92234702258727 |
| 37 | 73.6 | 70.7778162217659 | 2.82218377823407 |
| 38 | 71.3 | 69.1333809034908 | 2.16661909650924 |
| 39 | 71.2 | 70.2414815195072 | 0.958518480492813 |
| 40 | 81.4 | 71.292159137577 | 10.107840862423 |
| 41 | 76.1 | 71.0068203285421 | 5.0931796714579 |
| 42 | 71.1 | 70.6717073921971 | 0.428292607802869 |
| 43 | 75.7 | 70.2084938398357 | 5.49150616016427 |
| 44 | 70 | 69.0448285420945 | 0.955171457905543 |
| 45 | 68.5 | 67.4638367556468 | 1.03616324435318 |
| 46 | 56.7 | 63.107727926078 | -6.40772792607802 |
| 47 | 57.9 | 64.8168911704312 | -6.91689117043121 |
| 48 | 58.8 | 66.0821632443532 | -7.28216324435318 |
| 49 | 59.3 | 63.7273470225873 | -4.42734702258728 |
| 50 | 61.3 | 62.6951293634497 | -1.39512936344969 |
| 51 | 62.9 | 61.6604681724846 | 1.2395318275154 |
| 52 | 61.4 | 64.853907597536 | -3.45390759753593 |
| 53 | 64.5 | 62.4258069815195 | 2.07419301848049 |
| 54 | 63.8 | 62.0906940451745 | 1.70930595482546 |
| 55 | 61.6 | 63.4641334702259 | -1.86413347022587 |
| 56 | 64.7 | 63.8310123203285 | 0.868987679671462 |
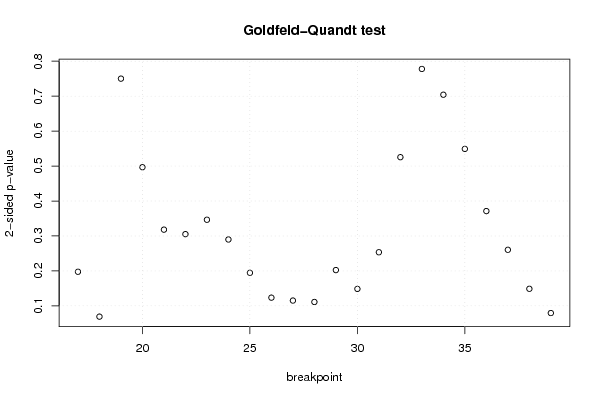
| Goldfeld-Quandt test for Heteroskedasticity | |||
| p-values | Alternative Hypothesis | ||
| breakpoint index | greater | 2-sided | less |
| 17 | 0.0987663768146036 | 0.197532753629207 | 0.901233623185396 |
| 18 | 0.0345285413246412 | 0.0690570826492823 | 0.965471458675359 |
| 19 | 0.375095551441394 | 0.750191102882787 | 0.624904448558606 |
| 20 | 0.24833998472399 | 0.49667996944798 | 0.75166001527601 |
| 21 | 0.159016368192979 | 0.318032736385959 | 0.84098363180702 |
| 22 | 0.152597315034320 | 0.305194630068640 | 0.84740268496568 |
| 23 | 0.173191390757733 | 0.346382781515466 | 0.826808609242267 |
| 24 | 0.144936743138430 | 0.289873486276861 | 0.85506325686157 |
| 25 | 0.0972737155468126 | 0.194547431093625 | 0.902726284453187 |
| 26 | 0.0617102525245052 | 0.123420505049010 | 0.938289747475495 |
| 27 | 0.057558882642169 | 0.115117765284338 | 0.94244111735783 |
| 28 | 0.055531012408959 | 0.111062024817918 | 0.94446898759104 |
| 29 | 0.101182528339676 | 0.202365056679353 | 0.898817471660324 |
| 30 | 0.0742513501735438 | 0.148502700347088 | 0.925748649826456 |
| 31 | 0.126685721581526 | 0.253371443163053 | 0.873314278418474 |
| 32 | 0.262716484195710 | 0.525432968391421 | 0.73728351580429 |
| 33 | 0.388972378687372 | 0.777944757374745 | 0.611027621312628 |
| 34 | 0.352094842682924 | 0.704189685365848 | 0.647905157317076 |
| 35 | 0.274551636381035 | 0.54910327276207 | 0.725448363618965 |
| 36 | 0.185589111931391 | 0.371178223862782 | 0.81441088806861 |
| 37 | 0.130191638226567 | 0.260383276453134 | 0.869808361773433 |
| 38 | 0.0743907717111535 | 0.148781543422307 | 0.925609228288847 |
| 39 | 0.0396939237952997 | 0.0793878475905994 | 0.9603060762047 |
| Meta Analysis of Goldfeld-Quandt test for Heteroskedasticity | |||
| Description | # significant tests | % significant tests | OK/NOK |
| 1% type I error level | 0 | 0 | OK |
| 5% type I error level | 0 | 0 | OK |
| 10% type I error level | 2 | 0.0869565217391304 | OK |