| Multiple Linear Regression - Estimated Regression Equation |
| TW[t] = + 8.1012229396126 + 0.0364793011773642CV[t] + e[t] |
| Multiple Linear Regression - Ordinary Least Squares | |||||
| Variable | Parameter | S.D. | T-STAT H0: parameter = 0 | 2-tail p-value | 1-tail p-value |
| (Intercept) | 8.1012229396126 | 0.13096 | 61.8602 | 0 | 0 |
| CV | 0.0364793011773642 | 0.017241 | 2.1159 | 0.038657 | 0.019329 |
| Multiple Linear Regression - Regression Statistics | |
| Multiple R | 0.267691926597655 |
| R-squared | 0.0716589675655644 |
| Adjusted R-squared | 0.0556530876960053 |
| F-TEST (value) | 4.47704019707464 |
| F-TEST (DF numerator) | 1 |
| F-TEST (DF denominator) | 58 |
| p-value | 0.0386571938482783 |
| Multiple Linear Regression - Residual Statistics | |
| Residual Standard Deviation | 0.722321951349474 |
| Sum Squared Residuals | 30.2614420812761 |
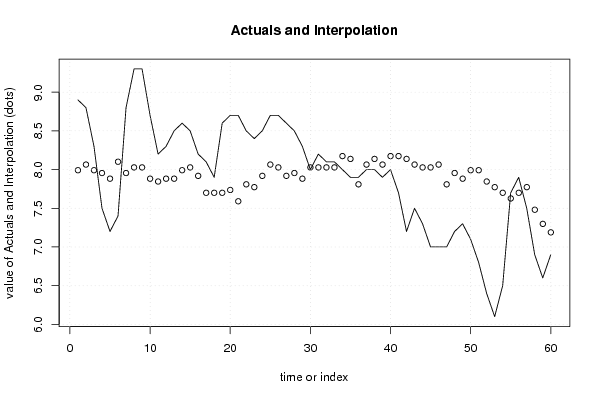
| Multiple Linear Regression - Actuals, Interpolation, and Residuals | |||
| Time or Index | Actuals | Interpolation Forecast | Residuals Prediction Error |
| 1 | 8.9 | 7.99178503608054 | 0.90821496391946 |
| 2 | 8.8 | 8.06474363843524 | 0.735256361564756 |
| 3 | 8.3 | 7.99178503608052 | 0.308214963919485 |
| 4 | 7.5 | 7.95530573490315 | -0.455305734903152 |
| 5 | 7.2 | 7.88234713254842 | -0.682347132548423 |
| 6 | 7.4 | 8.1012229396126 | -0.701222939612608 |
| 7 | 8.8 | 7.95530573490315 | 0.844694265096849 |
| 8 | 9.3 | 8.02826433725788 | 1.27173566274212 |
| 9 | 9.3 | 8.02826433725788 | 1.27173566274212 |
| 10 | 8.7 | 7.88234713254842 | 0.817652867451576 |
| 11 | 8.2 | 7.84586783137106 | 0.35413216862894 |
| 12 | 8.3 | 7.88234713254842 | 0.417652867451577 |
| 13 | 8.5 | 7.88234713254842 | 0.617652867451577 |
| 14 | 8.6 | 7.99178503608052 | 0.608214963919484 |
| 15 | 8.5 | 8.02826433725788 | 0.47173566274212 |
| 16 | 8.2 | 7.91882643372579 | 0.281173566274212 |
| 17 | 8.1 | 7.6999506266616 | 0.400049373338397 |
| 18 | 7.9 | 7.6999506266616 | 0.200049373338398 |
| 19 | 8.6 | 7.6999506266616 | 0.900049373338397 |
| 20 | 8.7 | 7.73642992783897 | 0.963570072161033 |
| 21 | 8.7 | 7.59051272312951 | 1.10948727687049 |
| 22 | 8.5 | 7.8093885301937 | 0.690611469806305 |
| 23 | 8.4 | 7.77290922901633 | 0.62709077098367 |
| 24 | 8.5 | 7.91882643372579 | 0.581173566274212 |
| 25 | 8.7 | 8.06474363843524 | 0.635256361564755 |
| 26 | 8.7 | 8.02826433725788 | 0.671735662742119 |
| 27 | 8.6 | 7.91882643372579 | 0.681173566274212 |
| 28 | 8.5 | 7.95530573490315 | 0.544694265096848 |
| 29 | 8.3 | 7.88234713254842 | 0.417652867451577 |
| 30 | 8 | 8.02826433725788 | -0.0282643372578802 |
| 31 | 8.2 | 8.02826433725788 | 0.171735662742119 |
| 32 | 8.1 | 8.02826433725788 | 0.0717356627421195 |
| 33 | 8.1 | 8.02826433725788 | 0.0717356627421195 |
| 34 | 8 | 8.17418154196734 | -0.174181541967337 |
| 35 | 7.9 | 8.13770224078997 | -0.237702240789972 |
| 36 | 7.9 | 7.8093885301937 | 0.0906114698063053 |
| 37 | 8 | 8.06474363843524 | -0.0647436384352444 |
| 38 | 8 | 8.13770224078997 | -0.137702240789973 |
| 39 | 7.9 | 8.06474363843524 | -0.164743638435244 |
| 40 | 8 | 8.17418154196734 | -0.174181541967337 |
| 41 | 7.7 | 8.17418154196734 | -0.474181541967337 |
| 42 | 7.2 | 8.13770224078997 | -0.937702240789973 |
| 43 | 7.5 | 8.06474363843524 | -0.564743638435244 |
| 44 | 7.3 | 8.02826433725788 | -0.72826433725788 |
| 45 | 7 | 8.02826433725788 | -1.02826433725788 |
| 46 | 7 | 8.06474363843524 | -1.06474363843524 |
| 47 | 7 | 7.8093885301937 | -0.809388530193695 |
| 48 | 7.2 | 7.95530573490315 | -0.755305734903152 |
| 49 | 7.3 | 7.88234713254842 | -0.582347132548424 |
| 50 | 7.1 | 7.99178503608052 | -0.891785036080516 |
| 51 | 6.8 | 7.99178503608052 | -1.19178503608052 |
| 52 | 6.4 | 7.84586783137106 | -1.44586783137106 |
| 53 | 6.1 | 7.77290922901633 | -1.67290922901633 |
| 54 | 6.5 | 7.6999506266616 | -1.19995062666160 |
| 55 | 7.7 | 7.62699202430687 | 0.0730079756931261 |
| 56 | 7.9 | 7.6999506266616 | 0.200049373338398 |
| 57 | 7.5 | 7.77290922901633 | -0.272909229016331 |
| 58 | 6.9 | 7.48107481959742 | -0.581074819597417 |
| 59 | 6.6 | 7.2986783137106 | -0.698678313710597 |
| 60 | 6.9 | 7.1892404101785 | -0.289240410178503 |
| Goldfeld-Quandt test for Heteroskedasticity | |||
| p-values | Alternative Hypothesis | ||
| breakpoint index | greater | 2-sided | less |
| 5 | 0.230740640539454 | 0.461481281078907 | 0.769259359460546 |
| 6 | 0.662326067688564 | 0.675347864622872 | 0.337673932311436 |
| 7 | 0.677380959116634 | 0.645238081766732 | 0.322619040883366 |
| 8 | 0.759396814749994 | 0.481206370500012 | 0.240603185250006 |
| 9 | 0.800503149458044 | 0.398993701083912 | 0.199496850541956 |
| 10 | 0.784468967216571 | 0.431062065566858 | 0.215531032783429 |
| 11 | 0.70631200844958 | 0.58737598310084 | 0.29368799155042 |
| 12 | 0.623356963165325 | 0.75328607366935 | 0.376643036834675 |
| 13 | 0.556269113986722 | 0.887461772026557 | 0.443730886013278 |
| 14 | 0.486522571687608 | 0.973045143375216 | 0.513477428312392 |
| 15 | 0.411251507618763 | 0.822503015237527 | 0.588748492381237 |
| 16 | 0.335103806789112 | 0.670207613578223 | 0.664896193210888 |
| 17 | 0.268775466690538 | 0.537550933381075 | 0.731224533309462 |
| 18 | 0.205584992821136 | 0.411169985642271 | 0.794415007178864 |
| 19 | 0.215129921706403 | 0.430259843412805 | 0.784870078293597 |
| 20 | 0.232652640103966 | 0.465305280207933 | 0.767347359896034 |
| 21 | 0.284671832921595 | 0.56934366584319 | 0.715328167078405 |
| 22 | 0.272229087304613 | 0.544458174609225 | 0.727770912695388 |
| 23 | 0.26126808682034 | 0.52253617364068 | 0.73873191317966 |
| 24 | 0.249027031597952 | 0.498054063195903 | 0.750972968402049 |
| 25 | 0.251631772536242 | 0.503263545072485 | 0.748368227463758 |
| 26 | 0.273014513605216 | 0.546029027210432 | 0.726985486394784 |
| 27 | 0.316037450671231 | 0.632074901342461 | 0.68396254932877 |
| 28 | 0.348968740081153 | 0.697937480162306 | 0.651031259918847 |
| 29 | 0.378858437202345 | 0.75771687440469 | 0.621141562797655 |
| 30 | 0.369251588564583 | 0.738503177129165 | 0.630748411435417 |
| 31 | 0.370510195732102 | 0.741020391464205 | 0.629489804267898 |
| 32 | 0.369265493634460 | 0.738530987268919 | 0.63073450636554 |
| 33 | 0.37447253194434 | 0.74894506388868 | 0.62552746805566 |
| 34 | 0.353861589369433 | 0.707723178738865 | 0.646138410630567 |
| 35 | 0.334959314390456 | 0.669918628780913 | 0.665040685609544 |
| 36 | 0.379810123766068 | 0.759620247532135 | 0.620189876233932 |
| 37 | 0.391166725830365 | 0.78233345166073 | 0.608833274169635 |
| 38 | 0.400530710634688 | 0.801061421269376 | 0.599469289365312 |
| 39 | 0.423912747103113 | 0.847825494206225 | 0.576087252896887 |
| 40 | 0.472845074233105 | 0.94569014846621 | 0.527154925766895 |
| 41 | 0.485218027786209 | 0.970436055572417 | 0.514781972213791 |
| 42 | 0.505616921268371 | 0.988766157463257 | 0.494383078731629 |
| 43 | 0.508864515724596 | 0.982270968550807 | 0.491135484275404 |
| 44 | 0.509806936534026 | 0.980386126931948 | 0.490193063465974 |
| 45 | 0.527864844517566 | 0.944270310964868 | 0.472135155482434 |
| 46 | 0.51834902579332 | 0.96330194841336 | 0.48165097420668 |
| 47 | 0.528402161328307 | 0.943195677343386 | 0.471597838671693 |
| 48 | 0.48467309602635 | 0.9693461920527 | 0.51532690397365 |
| 49 | 0.445942779589618 | 0.891885559179236 | 0.554057220410382 |
| 50 | 0.389382268015678 | 0.778764536031356 | 0.610617731984322 |
| 51 | 0.346388144988698 | 0.692776289977395 | 0.653611855011302 |
| 52 | 0.419661542278882 | 0.839323084557763 | 0.580338457721118 |
| 53 | 0.753384796282985 | 0.49323040743403 | 0.246615203717015 |
| 54 | 0.942776094668207 | 0.114447810663587 | 0.0572239053317933 |
| 55 | 0.886246104775537 | 0.227507790448927 | 0.113753895224463 |
| Meta Analysis of Goldfeld-Quandt test for Heteroskedasticity | |||
| Description | # significant tests | % significant tests | OK/NOK |
| 1% type I error level | 0 | 0 | OK |
| 5% type I error level | 0 | 0 | OK |
| 10% type I error level | 0 | 0 | OK |