| Multiple Linear Regression - Estimated Regression Equation |
| Y[t] = + 52.256193984698 -4.11718487866997X[t] + 0.220811068130770Y1[t] + 0.336607809560939Y2[t] -16.6367537407777M1[t] -24.0326149655328M2[t] + 7.5024817685998M3[t] -3.88948328986188M4[t] -9.8984806608981M5[t] -0.800380067444774M6[t] -10.3918250786584M7[t] -11.9106931547395M8[t] -8.9388430332159M9[t] -0.887711502151985M10[t] + 3.94199266424966M11[t] + 0.0617692125452959t + e[t] |
| Multiple Linear Regression - Ordinary Least Squares | |||||
| Variable | Parameter | S.D. | T-STAT H0: parameter = 0 | 2-tail p-value | 1-tail p-value |
| (Intercept) | 52.256193984698 | 13.757349 | 3.7984 | 0.000443 | 0.000222 |
| X | -4.11718487866997 | 2.827576 | -1.4561 | 0.152469 | 0.076234 |
| Y1 | 0.220811068130770 | 0.130152 | 1.6966 | 0.096845 | 0.048423 |
| Y2 | 0.336607809560939 | 0.129791 | 2.5935 | 0.012854 | 0.006427 |
| M1 | -16.6367537407777 | 3.207553 | -5.1867 | 5e-06 | 3e-06 |
| M2 | -24.0326149655328 | 3.799676 | -6.3249 | 0 | 0 |
| M3 | 7.5024817685998 | 4.293143 | 1.7475 | 0.087518 | 0.043759 |
| M4 | -3.88948328986188 | 3.952901 | -0.984 | 0.330517 | 0.165258 |
| M5 | -9.8984806608981 | 3.556994 | -2.7828 | 0.00791 | 0.003955 |
| M6 | -0.800380067444774 | 3.275642 | -0.2443 | 0.808101 | 0.404051 |
| M7 | -10.3918250786584 | 3.064577 | -3.3909 | 0.001481 | 0.00074 |
| M8 | -11.9106931547395 | 3.550716 | -3.3544 | 0.001645 | 0.000823 |
| M9 | -8.9388430332159 | 3.383603 | -2.6418 | 0.011375 | 0.005688 |
| M10 | -0.887711502151985 | 3.400153 | -0.2611 | 0.795249 | 0.397625 |
| M11 | 3.94199266424966 | 3.163533 | 1.2461 | 0.219332 | 0.109666 |
| t | 0.0617692125452959 | 0.074454 | 0.8296 | 0.411226 | 0.205613 |
| Multiple Linear Regression - Regression Statistics | |
| Multiple R | 0.902332302776116 |
| R-squared | 0.814203584633248 |
| Adjusted R-squared | 0.7508638975764 |
| F-TEST (value) | 12.8545564789813 |
| F-TEST (DF numerator) | 15 |
| F-TEST (DF denominator) | 44 |
| p-value | 1.81019643719083e-11 |
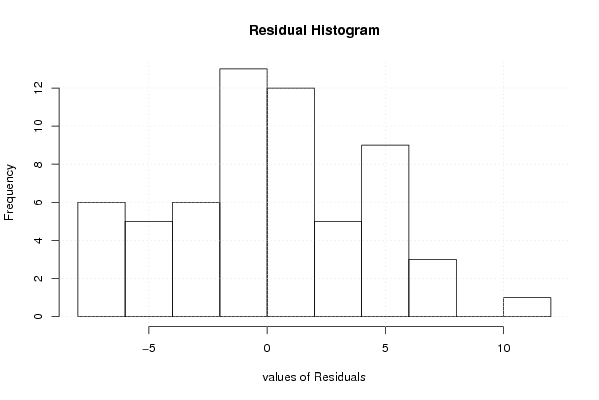
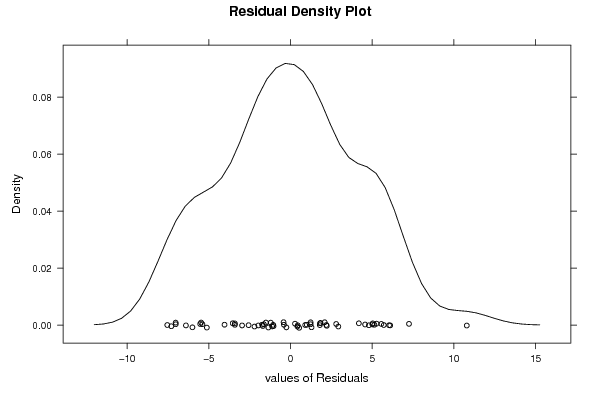
| Multiple Linear Regression - Residual Statistics | |
| Residual Standard Deviation | 4.80445749036213 |
| Sum Squared Residuals | 1015.64371817466 |
| Multiple Linear Regression - Actuals, Interpolation, and Residuals | |||
| Time or Index | Actuals | Interpolation Forecast | Residuals Prediction Error |
| 1 | 89.1 | 87.2952437883586 | 1.80475621164137 |
| 2 | 82.6 | 78.4170688180601 | 4.18293118193987 |
| 3 | 102.7 | 108.174733450415 | -5.47473345041491 |
| 4 | 91.8 | 99.094889311781 | -7.2948893117809 |
| 5 | 94.1 | 97.5066374828394 | -3.40663748283945 |
| 6 | 103.1 | 103.505347621325 | -0.405347621324616 |
| 7 | 93.2 | 96.7371693978234 | -3.53716939782339 |
| 8 | 91 | 96.1235112458414 | -5.1235112458414 |
| 9 | 94.3 | 95.3389289153693 | -1.03892891536929 |
| 10 | 99.4 | 103.439969002776 | -4.03996900277598 |
| 11 | 115.7 | 110.568384600741 | 5.13161539925906 |
| 12 | 116.8 | 112.004081388329 | 4.79591861167107 |
| 13 | 99.8 | 101.158696330884 | -1.35869633088371 |
| 14 | 96 | 90.4410847509678 | 5.55891524903223 |
| 15 | 115.9 | 115.476535876213 | 0.423464123787176 |
| 16 | 109.1 | 107.261370609767 | 1.83862939023281 |
| 17 | 117.3 | 106.511122598250 | 10.7888774017503 |
| 18 | 109.8 | 115.192710057906 | -5.39271005790625 |
| 19 | 112.8 | 106.767135286657 | 6.0328647133431 |
| 20 | 110.7 | 103.447911055806 | 7.25208894419367 |
| 21 | 100 | 107.027650575483 | -7.02765057548341 |
| 22 | 113.3 | 112.070996490015 | 1.22900350998458 |
| 23 | 122.4 | 116.297553512800 | 6.10244648720046 |
| 24 | 112.5 | 118.903594648246 | -6.40359464824567 |
| 25 | 104.2 | 103.205711612523 | 0.994288387476765 |
| 26 | 92.5 | 90.7064704201747 | 1.79352957982533 |
| 27 | 117.2 | 116.926002050367 | 0.273997949633184 |
| 28 | 109.3 | 107.111528215417 | 2.18847178458255 |
| 29 | 106.1 | 107.734105514849 | -1.63410551484863 |
| 30 | 118.8 | 113.528178207297 | 5.27182179270263 |
| 31 | 105.3 | 105.725657983295 | -0.425657983294858 |
| 32 | 106 | 105.562528881418 | 0.437471118582446 |
| 33 | 102 | 104.206510534105 | -2.20651053410530 |
| 34 | 112.9 | 111.671792471884 | 1.22820752811592 |
| 35 | 116.5 | 117.623675255213 | -1.12367525521267 |
| 36 | 114.8 | 118.207396772993 | -3.40739677299331 |
| 37 | 100.5 | 102.468821543358 | -1.96882154335802 |
| 38 | 85.4 | 91.4048979806245 | -6.00489798062453 |
| 39 | 114.6 | 114.854025121806 | -0.254025121806433 |
| 40 | 109.9 | 104.888734540938 | 5.01126545906168 |
| 41 | 100.7 | 107.732642401412 | -7.03264240141219 |
| 42 | 115.5 | 113.278993675671 | 2.22100632432867 |
| 43 | 100.7 | 99.8033449587078 | 0.896655041292176 |
| 44 | 99 | 100.060037868338 | -1.06003786833849 |
| 45 | 102.3 | 97.7364828050832 | 4.56351719491683 |
| 46 | 108.8 | 106.005826797270 | 2.79417320272967 |
| 47 | 105.9 | 113.443377890618 | -7.54337789061836 |
| 48 | 113.2 | 111.110753103481 | 2.08924689651913 |
| 49 | 95.7 | 95.1715267248764 | 0.528473275123591 |
| 50 | 80.9 | 86.4304780301729 | -5.5304780301729 |
| 51 | 113.9 | 108.868703501199 | 5.03129649880097 |
| 52 | 98.1 | 99.8434773220961 | -1.74347732209615 |
| 53 | 102.8 | 101.51549200265 | 1.28450799734997 |
| 54 | 104.7 | 106.394770437800 | -1.69477043780044 |
| 55 | 95.9 | 98.866692373517 | -2.96669237351703 |
| 56 | 94.6 | 96.1060109485962 | -1.50601094859622 |
| 57 | 101.6 | 95.8904271699588 | 5.70957283004116 |
| 58 | 103.9 | 105.111415238054 | -1.2114152380542 |
| 59 | 110.3 | 112.867008740628 | -2.56700874062849 |
| 60 | 114.1 | 111.174174086951 | 2.92582591304878 |
| Goldfeld-Quandt test for Heteroskedasticity | |||
| p-values | Alternative Hypothesis | ||
| breakpoint index | greater | 2-sided | less |
| 19 | 0.869075307891764 | 0.261849384216472 | 0.130924692108236 |
| 20 | 0.814716826246422 | 0.370566347507156 | 0.185283173753578 |
| 21 | 0.85174798323729 | 0.296504033525421 | 0.148252016762710 |
| 22 | 0.846989440551556 | 0.306021118896889 | 0.153010559448444 |
| 23 | 0.94424845473594 | 0.111503090528119 | 0.0557515452640594 |
| 24 | 0.998328137250768 | 0.00334372549846490 | 0.00167186274923245 |
| 25 | 0.997274695682457 | 0.0054506086350856 | 0.0027253043175428 |
| 26 | 0.997528610878277 | 0.00494277824344642 | 0.00247138912172321 |
| 27 | 0.9943443696376 | 0.0113112607247984 | 0.00565563036239919 |
| 28 | 0.98822498509394 | 0.0235500298121193 | 0.0117750149060597 |
| 29 | 0.984566569245833 | 0.0308668615083347 | 0.0154334307541674 |
| 30 | 0.982211590654233 | 0.0355768186915346 | 0.0177884093457673 |
| 31 | 0.971811079173001 | 0.0563778416539975 | 0.0281889208269987 |
| 32 | 0.965491117540715 | 0.0690177649185694 | 0.0345088824592847 |
| 33 | 0.950969035752081 | 0.0980619284958384 | 0.0490309642479192 |
| 34 | 0.914274740512324 | 0.171450518975352 | 0.0857252594876758 |
| 35 | 0.916394608813004 | 0.167210782373993 | 0.0836053911869964 |
| 36 | 0.884027845525573 | 0.231944308948854 | 0.115972154474427 |
| 37 | 0.82341976535224 | 0.353160469295521 | 0.176580234647761 |
| 38 | 0.770952054052808 | 0.458095891894384 | 0.229047945947192 |
| 39 | 0.716746408554063 | 0.566507182891874 | 0.283253591445937 |
| 40 | 0.73797755144934 | 0.52404489710132 | 0.26202244855066 |
| 41 | 0.797942771577721 | 0.404114456844557 | 0.202057228422279 |
| Meta Analysis of Goldfeld-Quandt test for Heteroskedasticity | |||
| Description | # significant tests | % significant tests | OK/NOK |
| 1% type I error level | 3 | 0.130434782608696 | NOK |
| 5% type I error level | 7 | 0.304347826086957 | NOK |
| 10% type I error level | 10 | 0.434782608695652 | NOK |