| Multiple Linear Regression - Estimated Regression Equation |
| Y[t] = + 295.147475775104 -1.66492981268395X[t] + 0.92094007036873`Y(t-1)`[t] -0.428433389858562`Y(t-4)`[t] + 0.233341475808244`Y(t-5)`[t] + 0.74824738479614t + e[t] |
| Multiple Linear Regression - Ordinary Least Squares | |||||
| Variable | Parameter | S.D. | T-STAT H0: parameter = 0 | 2-tail p-value | 1-tail p-value |
| (Intercept) | 295.147475775104 | 44.851297 | 6.5806 | 0 | 0 |
| X | -1.66492981268395 | 0.188413 | -8.8366 | 0 | 0 |
| `Y(t-1)` | 0.92094007036873 | 0.055851 | 16.4893 | 0 | 0 |
| `Y(t-4)` | -0.428433389858562 | 0.083759 | -5.1151 | 3e-06 | 2e-06 |
| `Y(t-5)` | 0.233341475808244 | 0.084726 | 2.7541 | 0.007746 | 0.003873 |
| t | 0.74824738479614 | 0.223406 | 3.3493 | 0.001393 | 0.000697 |
| Multiple Linear Regression - Regression Statistics | |
| Multiple R | 0.975558514327225 |
| R-squared | 0.951714414876342 |
| Adjusted R-squared | 0.94775658003014 |
| F-TEST (value) | 240.463397756413 |
| F-TEST (DF numerator) | 5 |
| F-TEST (DF denominator) | 61 |
| p-value | 0 |
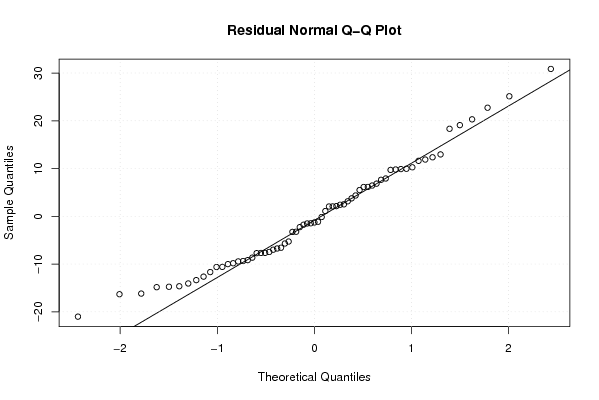
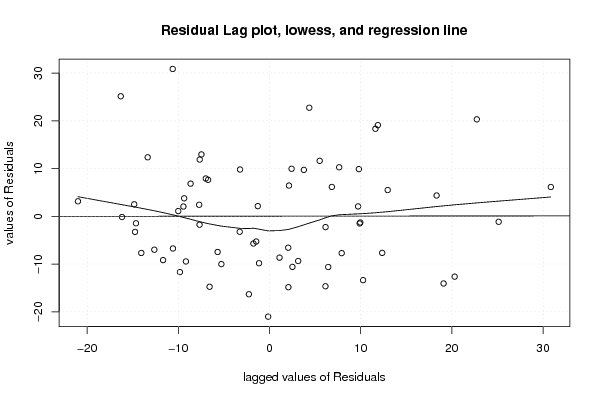
| Multiple Linear Regression - Residual Statistics | |
| Residual Standard Deviation | 11.6005175936534 |
| Sum Squared Residuals | 8208.8925148804 |
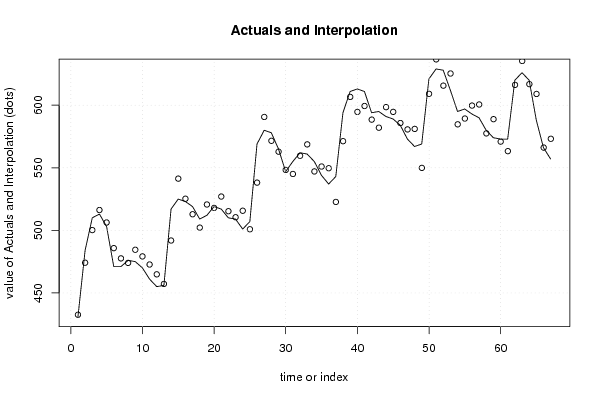
| Multiple Linear Regression - Actuals, Interpolation, and Residuals | |||
| Time or Index | Actuals | Interpolation Forecast | Residuals Prediction Error |
| 1 | 431 | 432.501157601142 | -1.50115760114177 |
| 2 | 484 | 474.108746261375 | 9.89125373862475 |
| 3 | 510 | 500.199348181538 | 9.8006518184625 |
| 4 | 513 | 516.23530592598 | -3.23530592598051 |
| 5 | 503 | 506.269739713973 | -3.26973971397268 |
| 6 | 471 | 485.755911023593 | -14.7559110235926 |
| 7 | 471 | 477.575092065238 | -6.57509206523761 |
| 8 | 476 | 473.947803681711 | 2.05219631828935 |
| 9 | 475 | 484.451602725629 | -9.45160272562922 |
| 10 | 470 | 479.172558611877 | -9.17255861187697 |
| 11 | 461 | 472.677474875749 | -11.6774748757491 |
| 12 | 455 | 464.826517471886 | -9.82651747188625 |
| 13 | 456 | 457.148954709123 | -1.14895470912309 |
| 14 | 517 | 491.861155134963 | 25.1388448650375 |
| 15 | 525 | 541.319868084565 | -16.3198680845649 |
| 16 | 523 | 525.265201861465 | -2.26520186146551 |
| 17 | 519 | 512.852986928518 | 6.14701307148239 |
| 18 | 509 | 502.16411368453 | 6.8358863154701 |
| 19 | 512 | 520.659142454107 | -8.65914245410753 |
| 20 | 519 | 517.9031876477 | 1.09681235230044 |
| 21 | 517 | 527.011038057968 | -10.0110380579682 |
| 22 | 510 | 515.282962870834 | -5.28296287083424 |
| 23 | 509 | 510.461225329638 | -1.46122532963783 |
| 24 | 501 | 515.648200480826 | -14.6482004808263 |
| 25 | 507 | 500.86363361187 | 6.13636638812996 |
| 26 | 569 | 538.140171993168 | 30.8598280068323 |
| 27 | 580 | 590.619422268316 | -10.6194222683160 |
| 28 | 578 | 571.560032797818 | 6.43996720218226 |
| 29 | 565 | 562.86570125216 | 2.13429874784043 |
| 30 | 547 | 548.289486951941 | -1.28948695194066 |
| 31 | 555 | 545.045597963329 | 9.95440203667066 |
| 32 | 562 | 559.581862587514 | 2.41813741248573 |
| 33 | 561 | 568.716274937337 | -7.71627493733682 |
| 34 | 555 | 547.082546024573 | 7.91745397542696 |
| 35 | 544 | 550.993851468043 | -6.99385146804268 |
| 36 | 537 | 549.636570126001 | -12.6365701260006 |
| 37 | 543 | 522.691043361157 | 20.3089566388435 |
| 38 | 594 | 571.260505535923 | 22.7394944640769 |
| 39 | 611 | 606.63907470389 | 4.36092529610998 |
| 40 | 613 | 594.672295020641 | 18.3277049793586 |
| 41 | 611 | 599.385165164565 | 11.6148348354351 |
| 42 | 594 | 588.497029181864 | 5.50297081813633 |
| 43 | 595 | 582.035681578189 | 12.9643184218106 |
| 44 | 591 | 598.469316031165 | -7.46931603116504 |
| 45 | 589 | 594.692944109331 | -5.6929441093307 |
| 46 | 584 | 585.76461367775 | -1.76461367774963 |
| 47 | 573 | 580.676288876203 | -7.67628887620293 |
| 48 | 567 | 581.0664406418 | -14.0664406418001 |
| 49 | 569 | 549.906657440461 | 19.0933425595385 |
| 50 | 621 | 609.114952782242 | 11.8850472177580 |
| 51 | 629 | 636.657182507893 | -7.65718250789253 |
| 52 | 628 | 615.64052283893 | 12.3594771610700 |
| 53 | 612 | 625.364902151384 | -13.3649021513836 |
| 54 | 595 | 584.737958632468 | 10.2620413675321 |
| 55 | 597 | 589.358558226602 | 7.64144177339846 |
| 56 | 593 | 599.738119330317 | -6.73811933031672 |
| 57 | 590 | 600.593818514004 | -10.5938185140040 |
| 58 | 580 | 577.488188474635 | 2.51181152536500 |
| 59 | 574 | 588.844324515009 | -14.8443245150091 |
| 60 | 573 | 570.929993711951 | 2.07000628804879 |
| 61 | 573 | 563.284065173107 | 9.71593482689325 |
| 62 | 620 | 616.232572559435 | 3.76742744056469 |
| 63 | 626 | 635.361748661103 | -9.36174866110294 |
| 64 | 620 | 616.85552468174 | 3.14447531826002 |
| 65 | 588 | 609.014409486953 | -21.0144094869528 |
| 66 | 566 | 566.149952622259 | -0.149952622259350 |
| 67 | 557 | 573.181702441035 | -16.1817024410347 |
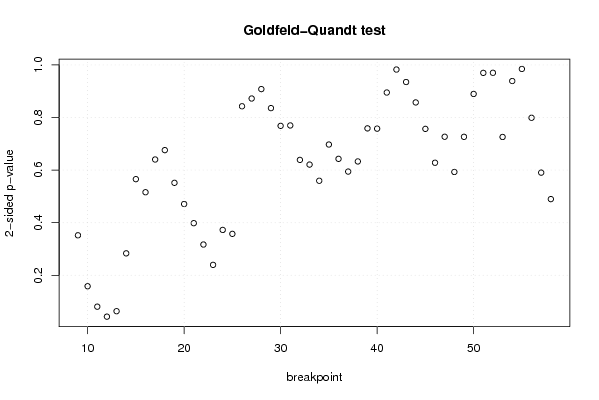
| Goldfeld-Quandt test for Heteroskedasticity | |||
| p-values | Alternative Hypothesis | ||
| breakpoint index | greater | 2-sided | less |
| 9 | 0.176015020488895 | 0.35203004097779 | 0.823984979511105 |
| 10 | 0.0791278541664545 | 0.158255708332909 | 0.920872145833545 |
| 11 | 0.0403070078996487 | 0.0806140157992974 | 0.959692992100351 |
| 12 | 0.0213207233934196 | 0.0426414467868393 | 0.97867927660658 |
| 13 | 0.0316930795450825 | 0.063386159090165 | 0.968306920454918 |
| 14 | 0.141719589267491 | 0.283439178534982 | 0.85828041073251 |
| 15 | 0.282773239665363 | 0.565546479330727 | 0.717226760334637 |
| 16 | 0.257899479040741 | 0.515798958081482 | 0.742100520959259 |
| 17 | 0.320178847461062 | 0.640357694922124 | 0.679821152538938 |
| 18 | 0.337963082085929 | 0.675926164171858 | 0.662036917914071 |
| 19 | 0.275802471762547 | 0.551604943525095 | 0.724197528237453 |
| 20 | 0.235518174691753 | 0.471036349383506 | 0.764481825308247 |
| 21 | 0.199069692055039 | 0.398139384110078 | 0.800930307944961 |
| 22 | 0.158463602083447 | 0.316927204166893 | 0.841536397916553 |
| 23 | 0.119796615630315 | 0.239593231260630 | 0.880203384369685 |
| 24 | 0.186240450741195 | 0.372480901482391 | 0.813759549258805 |
| 25 | 0.178770692330820 | 0.357541384661640 | 0.82122930766918 |
| 26 | 0.421352600630157 | 0.842705201260313 | 0.578647399369843 |
| 27 | 0.436133661828312 | 0.872267323656623 | 0.563866338171688 |
| 28 | 0.454037610913579 | 0.908075221827157 | 0.545962389086421 |
| 29 | 0.417890459252035 | 0.83578091850407 | 0.582109540747965 |
| 30 | 0.384153868833564 | 0.768307737667127 | 0.615846131166436 |
| 31 | 0.384903801707382 | 0.769807603414764 | 0.615096198292618 |
| 32 | 0.319381870690545 | 0.63876374138109 | 0.680618129309455 |
| 33 | 0.310472128030313 | 0.620944256060625 | 0.689527871969687 |
| 34 | 0.279716783470794 | 0.559433566941589 | 0.720283216529206 |
| 35 | 0.348652077688386 | 0.697304155376772 | 0.651347922311614 |
| 36 | 0.67858319423312 | 0.642833611533761 | 0.321416805766880 |
| 37 | 0.702820769317969 | 0.594358461364063 | 0.297179230682031 |
| 38 | 0.683539000113318 | 0.632921999773364 | 0.316460999886682 |
| 39 | 0.620607226446943 | 0.758785547106114 | 0.379392773553057 |
| 40 | 0.621170676939902 | 0.757658646120196 | 0.378829323060098 |
| 41 | 0.552467258017151 | 0.895065483965698 | 0.447532741982849 |
| 42 | 0.49119844916687 | 0.98239689833374 | 0.50880155083313 |
| 43 | 0.467506667338823 | 0.935013334677647 | 0.532493332661177 |
| 44 | 0.428662372699190 | 0.857324745398379 | 0.57133762730081 |
| 45 | 0.378398983138663 | 0.756797966277326 | 0.621601016861337 |
| 46 | 0.313986358158856 | 0.627972716317713 | 0.686013641841144 |
| 47 | 0.363426142131972 | 0.726852284263945 | 0.636573857868028 |
| 48 | 0.703521504348107 | 0.592956991303786 | 0.296478495651893 |
| 49 | 0.636746444641612 | 0.726507110716776 | 0.363253555358388 |
| 50 | 0.555162956242792 | 0.889674087514415 | 0.444837043757208 |
| 51 | 0.515103250001496 | 0.969793499997008 | 0.484896749998504 |
| 52 | 0.485043887125869 | 0.970087774251737 | 0.514956112874131 |
| 53 | 0.63697326733911 | 0.72605346532178 | 0.36302673266089 |
| 54 | 0.530619829330585 | 0.93876034133883 | 0.469380170669415 |
| 55 | 0.492349152330015 | 0.98469830466003 | 0.507650847669985 |
| 56 | 0.399496859498894 | 0.798993718997788 | 0.600503140501106 |
| 57 | 0.295175435019488 | 0.590350870038977 | 0.704824564980512 |
| 58 | 0.24483851195475 | 0.4896770239095 | 0.75516148804525 |
| Meta Analysis of Goldfeld-Quandt test for Heteroskedasticity | |||
| Description | # significant tests | % significant tests | OK/NOK |
| 1% type I error level | 0 | 0 | OK |
| 5% type I error level | 1 | 0.02 | OK |
| 10% type I error level | 3 | 0.06 | OK |