| Multiple Linear Regression - Estimated Regression Equation |
| WklBe[t] = + 20.2333699019754 + 12.2075193097678X[t] + 0.938893442766383Y1[t] + 3.6415169074981M1[t] + 19.4702236275926M2[t] + 19.6449073887394M3[t] + 13.6073698384394M4[t] + 8.97875032184423M5[t] + 12.4690406419745M6[t] + 6.19153587959245M7[t] + 19.1351704623620M8[t] + 68.497632912062M9[t] + 28.6543166662093M10[t] + 6.52969328591078M11[t] -0.228028023786069t + e[t] |
| Multiple Linear Regression - Ordinary Least Squares | |||||
| Variable | Parameter | S.D. | T-STAT H0: parameter = 0 | 2-tail p-value | 1-tail p-value |
| (Intercept) | 20.2333699019754 | 24.365096 | 0.8304 | 0.410588 | 0.205294 |
| X | 12.2075193097678 | 3.246616 | 3.7601 | 0.000478 | 0.000239 |
| Y1 | 0.938893442766383 | 0.037378 | 25.1188 | 0 | 0 |
| M1 | 3.6415169074981 | 3.787682 | 0.9614 | 0.341373 | 0.170686 |
| M2 | 19.4702236275926 | 4.175241 | 4.6633 | 2.7e-05 | 1.3e-05 |
| M3 | 19.6449073887394 | 4.111743 | 4.7778 | 1.8e-05 | 9e-06 |
| M4 | 13.6073698384394 | 4.058346 | 3.3529 | 0.001607 | 0.000804 |
| M5 | 8.97875032184423 | 4.076171 | 2.2027 | 0.032662 | 0.016331 |
| M6 | 12.4690406419745 | 4.152328 | 3.0029 | 0.004314 | 0.002157 |
| M7 | 6.19153587959245 | 4.187855 | 1.4785 | 0.146103 | 0.073051 |
| M8 | 19.1351704623620 | 4.321045 | 4.4284 | 5.8e-05 | 2.9e-05 |
| M9 | 68.497632912062 | 4.253086 | 16.1054 | 0 | 0 |
| M10 | 28.6543166662093 | 3.920295 | 7.3092 | 0 | 0 |
| M11 | 6.52969328591078 | 3.898342 | 1.675 | 0.100722 | 0.050361 |
| t | -0.228028023786069 | 0.112217 | -2.032 | 0.047948 | 0.023974 |
| Multiple Linear Regression - Regression Statistics | |
| Multiple R | 0.99131764863593 |
| R-squared | 0.982710680497068 |
| Adjusted R-squared | 0.977448713691828 |
| F-TEST (value) | 186.757293778141 |
| F-TEST (DF numerator) | 14 |
| F-TEST (DF denominator) | 46 |
| p-value | 0 |
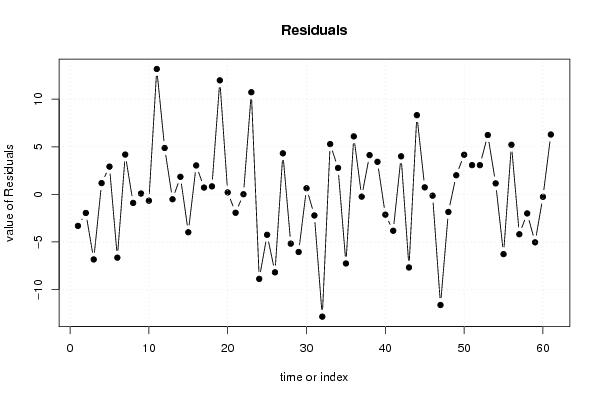
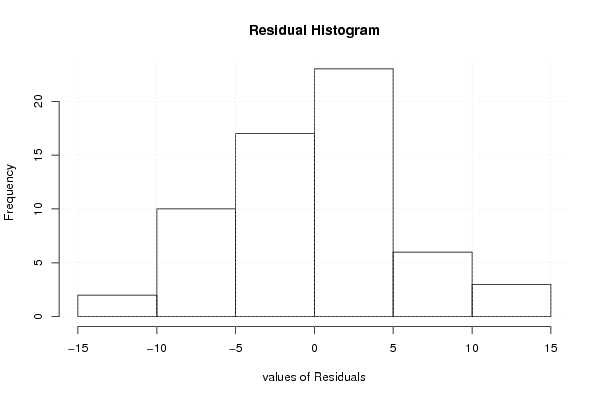
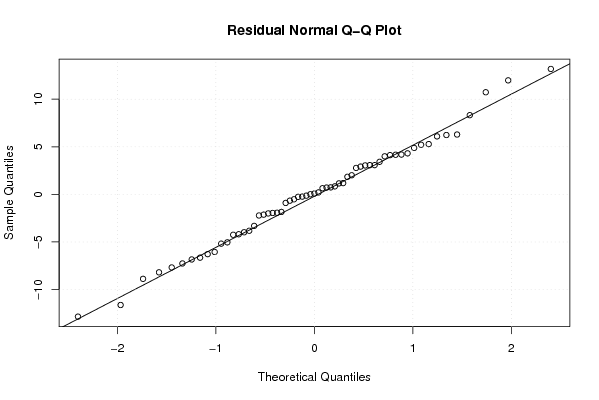
| Multiple Linear Regression - Residual Statistics | |
| Residual Standard Deviation | 6.13434875972176 |
| Sum Squared Residuals | 1730.99079647139 |
| Multiple Linear Regression - Actuals, Interpolation, and Residuals | |||
| Time or Index | Actuals | Interpolation Forecast | Residuals Prediction Error |
| 1 | 594 | 597.310752315947 | -3.31075231594699 |
| 2 | 595 | 596.950242485227 | -1.95024248522725 |
| 3 | 591 | 597.835791665354 | -6.83579166535411 |
| 4 | 589 | 587.814652320203 | 1.18534767979727 |
| 5 | 584 | 581.080217894289 | 2.91978210571125 |
| 6 | 573 | 579.648012976801 | -6.64801297680103 |
| 7 | 567 | 562.814652320203 | 4.18534767979728 |
| 8 | 569 | 569.896898222588 | -0.896898222587899 |
| 9 | 621 | 620.909119534035 | 0.090880465965351 |
| 10 | 629 | 629.660234288248 | -0.660234288247722 |
| 11 | 628 | 614.818730426294 | 13.1812695737058 |
| 12 | 612 | 607.122115673831 | 4.8778843261691 |
| 13 | 595 | 595.513309473281 | -0.51330947328087 |
| 14 | 597 | 595.152799642561 | 1.84720035743922 |
| 15 | 593 | 596.977242265454 | -3.97724226545428 |
| 16 | 590 | 586.956102920303 | 3.04389707969735 |
| 17 | 580 | 579.282775051622 | 0.717224948377686 |
| 18 | 574 | 573.156102920303 | 0.843897079697348 |
| 19 | 573 | 561.017209477536 | 11.9827905224637 |
| 20 | 573 | 572.793922593753 | 0.206077406246619 |
| 21 | 620 | 621.928357019667 | -1.92835701966734 |
| 22 | 626 | 625.985004560049 | 0.0149954399514611 |
| 23 | 620 | 609.265713812562 | 10.7342861874378 |
| 24 | 588 | 596.874631846267 | -8.87463184626706 |
| 25 | 566 | 570.243530561455 | -4.24353056145485 |
| 26 | 557 | 565.188553516903 | -8.18855351690285 |
| 27 | 561 | 556.685168269366 | 4.31483173063386 |
| 28 | 549 | 554.175176466346 | -5.17517646634559 |
| 29 | 532 | 538.051807612768 | -6.0518076127678 |
| 30 | 526 | 525.352881382083 | 0.647118617916534 |
| 31 | 511 | 513.213987939317 | -2.21398793931709 |
| 32 | 499 | 511.846192856805 | -12.8461928568048 |
| 33 | 555 | 549.713905969522 | 5.28609403047781 |
| 34 | 565 | 562.220594494801 | 2.77940550519916 |
| 35 | 542 | 549.25687751838 | -7.25687751838005 |
| 36 | 527 | 520.904607025056 | 6.0953929749436 |
| 37 | 510 | 510.234694267273 | -0.234694267272696 |
| 38 | 514 | 509.874184436553 | 4.12581556344739 |
| 39 | 517 | 513.576413944979 | 3.42358605502113 |
| 40 | 508 | 510.127528699192 | -2.12752869919194 |
| 41 | 493 | 496.820840173913 | -3.82084017391330 |
| 42 | 490 | 485.999700828762 | 4.00029917123828 |
| 43 | 469 | 476.677487714295 | -7.67748771429449 |
| 44 | 478 | 469.676331975184 | 8.32366802481606 |
| 45 | 528 | 527.260807385995 | 0.739192614004657 |
| 46 | 534 | 534.134135254676 | -0.134135254675692 |
| 47 | 518 | 529.622363816957 | -11.6223638169572 |
| 48 | 506 | 507.842347422998 | -1.84234742299818 |
| 49 | 502 | 499.989114993514 | 2.01088500648638 |
| 50 | 516 | 511.834219918757 | 4.16578008124349 |
| 51 | 528 | 524.925383854847 | 3.0746161451534 |
| 52 | 533 | 529.926539593957 | 3.07346040604291 |
| 53 | 536 | 529.764359267408 | 6.23564073259218 |
| 54 | 537 | 535.843301892051 | 1.15669810794887 |
| 55 | 524 | 530.276662548649 | -6.27666254864943 |
| 56 | 536 | 530.78665435167 | 5.21334564833005 |
| 57 | 587 | 591.18781009078 | -4.18781009078047 |
| 58 | 597 | 599.000031402227 | -2.00003140222721 |
| 59 | 581 | 586.036314425806 | -5.03631442580641 |
| 60 | 564 | 564.256298031847 | -0.256298031847452 |
| 61 | 558 | 551.708598388531 | 6.29140161146902 |
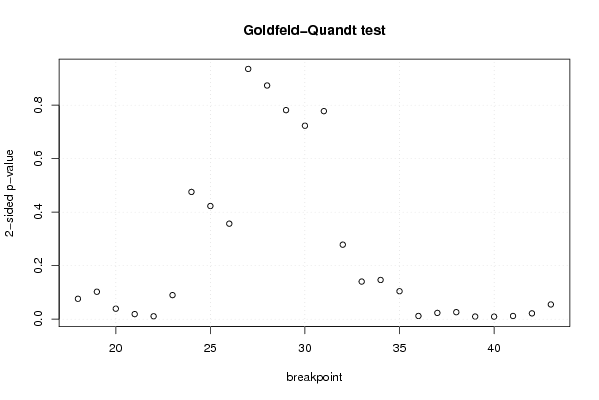
| Goldfeld-Quandt test for Heteroskedasticity | |||
| p-values | Alternative Hypothesis | ||
| breakpoint index | greater | 2-sided | less |
| 18 | 0.0380137260471209 | 0.0760274520942418 | 0.96198627395288 |
| 19 | 0.0512038254832221 | 0.102407650966444 | 0.948796174516778 |
| 20 | 0.0195148631008568 | 0.0390297262017137 | 0.980485136899143 |
| 21 | 0.00940613096043565 | 0.0188122619208713 | 0.990593869039564 |
| 22 | 0.00536555308338682 | 0.0107311061667736 | 0.994634446916613 |
| 23 | 0.0448834995103829 | 0.0897669990207659 | 0.955116500489617 |
| 24 | 0.237795248467616 | 0.475590496935232 | 0.762204751532384 |
| 25 | 0.211425904749342 | 0.422851809498684 | 0.788574095250658 |
| 26 | 0.178418454394204 | 0.356836908788408 | 0.821581545605796 |
| 27 | 0.467685655697874 | 0.935371311395748 | 0.532314344302126 |
| 28 | 0.436746902133036 | 0.873493804266072 | 0.563253097866964 |
| 29 | 0.390688411543659 | 0.781376823087318 | 0.609311588456341 |
| 30 | 0.361564390777614 | 0.723128781555228 | 0.638435609222386 |
| 31 | 0.388793030245388 | 0.777586060490775 | 0.611206969754612 |
| 32 | 0.860815723653575 | 0.278368552692850 | 0.139184276346425 |
| 33 | 0.929773952092231 | 0.140452095815538 | 0.070226047907769 |
| 34 | 0.926751926895026 | 0.146496146209948 | 0.0732480731049739 |
| 35 | 0.947846406621162 | 0.104307186757676 | 0.0521535933788382 |
| 36 | 0.994089279971152 | 0.0118214400576969 | 0.00591072002884845 |
| 37 | 0.988316409654688 | 0.0233671806906243 | 0.0116835903453122 |
| 38 | 0.986990140864586 | 0.0260197182708283 | 0.0130098591354142 |
| 39 | 0.9951569324387 | 0.00968613512259855 | 0.00484306756129928 |
| 40 | 0.99535105706347 | 0.00929788587305844 | 0.00464894293652922 |
| 41 | 0.994127063214608 | 0.011745873570783 | 0.0058729367853915 |
| 42 | 0.98920670612142 | 0.0215865877571617 | 0.0107932938785808 |
| 43 | 0.972566608180448 | 0.0548667836391033 | 0.0274333918195516 |
| Meta Analysis of Goldfeld-Quandt test for Heteroskedasticity | |||
| Description | # significant tests | % significant tests | OK/NOK |
| 1% type I error level | 2 | 0.0769230769230769 | NOK |
| 5% type I error level | 10 | 0.384615384615385 | NOK |
| 10% type I error level | 13 | 0.5 | NOK |