| Multiple Linear Regression - Estimated Regression Equation |
| Y[t] = -99.7566815768365 + 0.382755975409948X[t] + 1.02354018150553`Y(t-1)`[t] + 0.104099099931590`Y(t-4)`[t] + 0.00510435475890887`Y(t-5)`[t] + 4.0412038052447M1[t] + 67.3233309731705M2[t] + 21.7024053188966M3[t] + 3.10372942599408M4[t] -8.80075905104333M5[t] -17.7562793542933M6[t] + 4.46357831698049M7[t] + 4.86982749424487M8[t] + 1.88816508082327M9[t] -4.80574981277827M10[t] -2.9185475181839M11[t] -0.470059344867009t + e[t] |
| Multiple Linear Regression - Ordinary Least Squares | |||||
| Variable | Parameter | S.D. | T-STAT H0: parameter = 0 | 2-tail p-value | 1-tail p-value |
| (Intercept) | -99.7566815768365 | 41.611218 | -2.3974 | 0.020291 | 0.010146 |
| X | 0.382755975409948 | 0.240011 | 1.5947 | 0.117072 | 0.058536 |
| `Y(t-1)` | 1.02354018150553 | 0.074896 | 13.6661 | 0 | 0 |
| `Y(t-4)` | 0.104099099931590 | 0.174031 | 0.5982 | 0.55243 | 0.276215 |
| `Y(t-5)` | 0.00510435475890887 | 0.159946 | 0.0319 | 0.974669 | 0.487334 |
| M1 | 4.0412038052447 | 3.873252 | 1.0434 | 0.301799 | 0.1509 |
| M2 | 67.3233309731705 | 5.603693 | 12.0141 | 0 | 0 |
| M3 | 21.7024053188966 | 6.548458 | 3.3141 | 0.001715 | 0.000858 |
| M4 | 3.10372942599408 | 7.725819 | 0.4017 | 0.689591 | 0.344796 |
| M5 | -8.80075905104333 | 7.69218 | -1.1441 | 0.258023 | 0.129011 |
| M6 | -17.7562793542933 | 9.010969 | -1.9705 | 0.054329 | 0.027164 |
| M7 | 4.46357831698049 | 4.085768 | 1.0925 | 0.279863 | 0.139931 |
| M8 | 4.86982749424487 | 4.134005 | 1.178 | 0.244376 | 0.122188 |
| M9 | 1.88816508082327 | 4.263069 | 0.4429 | 0.65974 | 0.32987 |
| M10 | -4.80574981277827 | 5.161882 | -0.931 | 0.356323 | 0.178162 |
| M11 | -2.9185475181839 | 3.500481 | -0.8338 | 0.408384 | 0.204192 |
| t | -0.470059344867009 | 0.172063 | -2.7319 | 0.008679 | 0.004339 |
| Multiple Linear Regression - Regression Statistics | |
| Multiple R | 0.995733449711533 |
| R-squared | 0.99148510287443 |
| Adjusted R-squared | 0.988760335794248 |
| F-TEST (value) | 363.878846777648 |
| F-TEST (DF numerator) | 16 |
| F-TEST (DF denominator) | 50 |
| p-value | 0 |
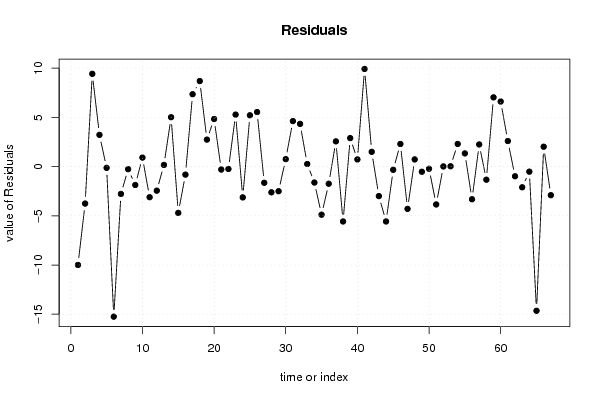
| Multiple Linear Regression - Residual Statistics | |
| Residual Standard Deviation | 5.38069327362718 |
| Sum Squared Residuals | 1447.59300524284 |
| Multiple Linear Regression - Actuals, Interpolation, and Residuals | |||
| Time or Index | Actuals | Interpolation Forecast | Residuals Prediction Error |
| 1 | 431 | 440.995986249429 | -9.99598624942896 |
| 2 | 484 | 487.759982902138 | -3.75998290213822 |
| 3 | 510 | 500.578636629142 | 9.42136337085846 |
| 4 | 513 | 509.779093282283 | 3.22090671771729 |
| 5 | 503 | 503.134090215368 | -0.134090215368056 |
| 6 | 471 | 486.247271849365 | -15.2472718493649 |
| 7 | 471 | 473.780922453283 | -2.78092245328301 |
| 8 | 476 | 476.267280673961 | -0.267280673961445 |
| 9 | 475 | 476.86930629062 | -1.86930629062032 |
| 10 | 470 | 469.088861281805 | 0.911138718195271 |
| 11 | 461 | 464.114971643031 | -3.11497164303055 |
| 12 | 455 | 457.451062109505 | -2.45106210950471 |
| 13 | 456 | 455.835829288319 | 0.164170711680960 |
| 14 | 517 | 511.988300698301 | 5.01169930169949 |
| 15 | 525 | 529.705664547819 | -4.70566454781862 |
| 16 | 523 | 523.819505405741 | -0.819505405740737 |
| 17 | 519 | 511.65305925204 | 7.34694074795991 |
| 18 | 509 | 500.316428196518 | 8.68357180348152 |
| 19 | 512 | 509.26225018614 | 2.73774981386033 |
| 20 | 519 | 514.168579468475 | 4.83142053152457 |
| 21 | 517 | 517.301931481317 | -0.301931481317353 |
| 22 | 510 | 510.24461865493 | -0.244618654929754 |
| 23 | 509 | 503.724792952717 | 5.27520704728275 |
| 24 | 501 | 504.133070221441 | -3.13307022144072 |
| 25 | 507 | 501.793063755847 | 5.20693624415297 |
| 26 | 569 | 563.46234307939 | 5.53765692061006 |
| 27 | 580 | 581.647909688873 | -1.64790968887270 |
| 28 | 578 | 580.61706320411 | -2.61706320411020 |
| 29 | 565 | 567.506431133992 | -2.5064311339919 |
| 30 | 547 | 546.245496172745 | 0.754503827255213 |
| 31 | 555 | 550.382446168155 | 4.61755383184498 |
| 32 | 562 | 557.665946399344 | 4.33405360065648 |
| 33 | 561 | 560.742745256244 | 0.257254743755970 |
| 34 | 555 | 556.624359239572 | -1.62435923957166 |
| 35 | 544 | 548.890166955041 | -4.89016695504074 |
| 36 | 537 | 538.744083804635 | -1.74408380463454 |
| 37 | 543 | 540.440662033594 | 2.55933796640645 |
| 38 | 594 | 599.578128581498 | -5.57812858149836 |
| 39 | 611 | 608.109882780192 | 2.89011721980806 |
| 40 | 613 | 612.278167400739 | 0.721832599260754 |
| 41 | 611 | 601.085091351565 | 9.91490864843475 |
| 42 | 594 | 592.502473322878 | 1.49752667712190 |
| 43 | 595 | 598.00175661179 | -3.00175661178942 |
| 44 | 591 | 596.577167028587 | -5.57716702858733 |
| 45 | 589 | 589.330877821964 | -0.330877821964188 |
| 46 | 584 | 581.708182395737 | 2.29181760426274 |
| 47 | 573 | 577.297713153688 | -4.29771315368823 |
| 48 | 567 | 566.27701420105 | 0.722985798949873 |
| 49 | 569 | 569.525846364973 | -0.525846364972995 |
| 50 | 621 | 621.223343153339 | -0.223343153338821 |
| 51 | 629 | 632.85062415551 | -3.85062415551058 |
| 52 | 628 | 627.987697437522 | 0.0123025624782818 |
| 53 | 612 | 611.973062884929 | 0.0269371150711113 |
| 54 | 595 | 592.704194567373 | 2.29580543262719 |
| 55 | 597 | 595.664115214937 | 1.33588478506305 |
| 56 | 593 | 596.321026429632 | -3.32102642963226 |
| 57 | 590 | 587.755139149854 | 2.2448608501459 |
| 58 | 580 | 581.333978427957 | -1.33397842795659 |
| 59 | 574 | 566.972355295523 | 7.02764470447678 |
| 60 | 573 | 566.39476966337 | 6.6052303366301 |
| 61 | 573 | 570.408612307838 | 2.59138769216159 |
| 62 | 620 | 620.987901585334 | -0.987901585334136 |
| 63 | 626 | 628.107282198465 | -2.10728219846462 |
| 64 | 620 | 620.518473269605 | -0.518473269605384 |
| 65 | 588 | 602.648265162106 | -14.6482651621058 |
| 66 | 566 | 563.984135891121 | 2.01586410887912 |
| 67 | 557 | 559.908509365696 | -2.90850936569592 |
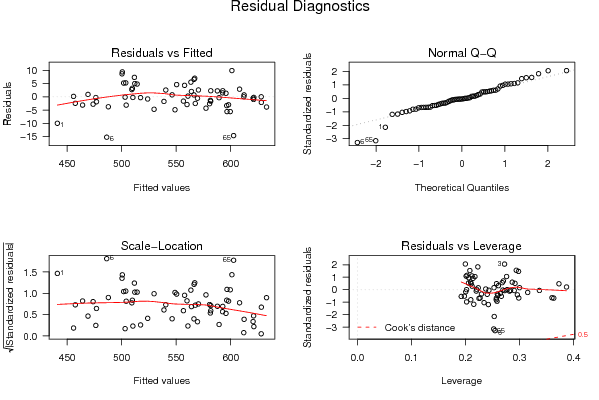
| Goldfeld-Quandt test for Heteroskedasticity | |||
| p-values | Alternative Hypothesis | ||
| breakpoint index | greater | 2-sided | less |
| 20 | 0.991031090418966 | 0.0179378191620689 | 0.00896890958103446 |
| 21 | 0.980480739497157 | 0.0390385210056862 | 0.0195192605028431 |
| 22 | 0.979965199431541 | 0.0400696011369174 | 0.0200348005684587 |
| 23 | 0.963125401502 | 0.073749196995999 | 0.0368745984979995 |
| 24 | 0.947283747100046 | 0.105432505799908 | 0.052716252899954 |
| 25 | 0.913758035570376 | 0.172483928859248 | 0.086241964429624 |
| 26 | 0.890289125525815 | 0.219421748948369 | 0.109710874474185 |
| 27 | 0.872630686463213 | 0.254738627073574 | 0.127369313536787 |
| 28 | 0.865523499670982 | 0.268953000658036 | 0.134476500329018 |
| 29 | 0.85740535179969 | 0.285189296400619 | 0.142594648200310 |
| 30 | 0.797845219316633 | 0.404309561366735 | 0.202154780683367 |
| 31 | 0.74102738373671 | 0.517945232526581 | 0.258972616263290 |
| 32 | 0.715831903255322 | 0.568336193489355 | 0.284168096744678 |
| 33 | 0.630818268457685 | 0.738363463084631 | 0.369181731542315 |
| 34 | 0.542866406210782 | 0.914267187578437 | 0.457133593789219 |
| 35 | 0.534159790556587 | 0.931680418886827 | 0.465840209443413 |
| 36 | 0.5321923496078 | 0.9356153007844 | 0.4678076503922 |
| 37 | 0.432833040337926 | 0.865666080675852 | 0.567166959662074 |
| 38 | 0.462684875128174 | 0.925369750256348 | 0.537315124871826 |
| 39 | 0.369301831757289 | 0.738603663514577 | 0.630698168242711 |
| 40 | 0.28697433970062 | 0.57394867940124 | 0.71302566029938 |
| 41 | 0.802059801433982 | 0.395880397132036 | 0.197940198566018 |
| 42 | 0.721772522136285 | 0.556454955727429 | 0.278227477863715 |
| 43 | 0.609316034326797 | 0.781367931346405 | 0.390683965673203 |
| 44 | 0.542856323667931 | 0.914287352664137 | 0.457143676332069 |
| 45 | 0.434957579645048 | 0.869915159290097 | 0.565042420354952 |
| 46 | 0.298746710327182 | 0.597493420654363 | 0.701253289672819 |
| 47 | 0.333503329456493 | 0.667006658912986 | 0.666496670543507 |
| Meta Analysis of Goldfeld-Quandt test for Heteroskedasticity | |||
| Description | # significant tests | % significant tests | OK/NOK |
| 1% type I error level | 0 | 0 | OK |
| 5% type I error level | 3 | 0.107142857142857 | NOK |
| 10% type I error level | 4 | 0.142857142857143 | NOK |