| Multiple Linear Regression - Estimated Regression Equation |
| Y[t] = + 574.162403631772 -8.1741746581782X[t] + 1.58594568458370M1[t] + 21.2938136298923M2[t] + 34.184264109383M3[t] + 25.3668466435652M4[t] -24.6887689042899M5[t] -26.8887689042899M6[t] -15.1983184247992M7[t] -9.87135143847206M8[t] -0.090450479490666M9[t] + 3.61909904101863M10[t] + 2.23651650683645M11[t] + e[t] |
| Multiple Linear Regression - Ordinary Least Squares | |||||
| Variable | Parameter | S.D. | T-STAT H0: parameter = 0 | 2-tail p-value | 1-tail p-value |
| (Intercept) | 574.162403631772 | 18.99184 | 30.2321 | 0 | 0 |
| X | -8.1741746581782 | 3.155104 | -2.5908 | 0.012714 | 0.006357 |
| M1 | 1.58594568458370 | 24.409742 | 0.065 | 0.948472 | 0.474236 |
| M2 | 21.2938136298923 | 24.379708 | 0.8734 | 0.386873 | 0.193437 |
| M3 | 34.184264109383 | 24.371132 | 1.4027 | 0.167291 | 0.083646 |
| M4 | 25.3668466435652 | 24.386241 | 1.0402 | 0.303563 | 0.151782 |
| M5 | -24.6887689042899 | 24.36623 | -1.0132 | 0.316135 | 0.158067 |
| M6 | -26.8887689042899 | 24.36623 | -1.1035 | 0.275417 | 0.137708 |
| M7 | -15.1983184247992 | 24.360101 | -0.6239 | 0.535708 | 0.267854 |
| M8 | -9.87135143847206 | 24.356832 | -0.4053 | 0.68711 | 0.343555 |
| M9 | -0.090450479490666 | 24.350946 | -0.0037 | 0.997052 | 0.498526 |
| M10 | 3.61909904101863 | 24.353153 | 0.1486 | 0.882498 | 0.441249 |
| M11 | 2.23651650683645 | 24.350292 | 0.0918 | 0.927209 | 0.463605 |
| Multiple Linear Regression - Regression Statistics | |
| Multiple R | 0.551464014387481 |
| R-squared | 0.304112559164356 |
| Adjusted R-squared | 0.126439170014830 |
| F-TEST (value) | 1.71163819534292 |
| F-TEST (DF numerator) | 12 |
| F-TEST (DF denominator) | 47 |
| p-value | 0.094537415037612 |
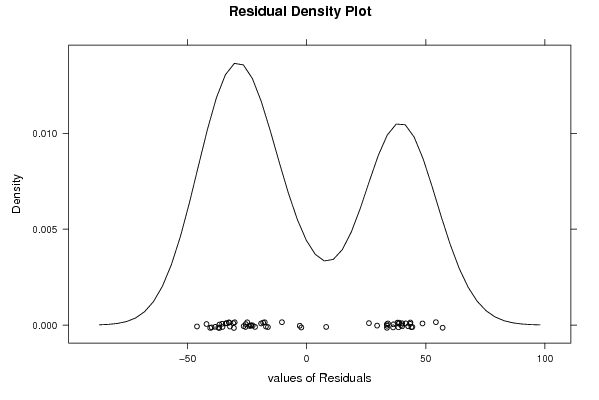
| Multiple Linear Regression - Residual Statistics | |
| Residual Standard Deviation | 38.5010623246821 |
| Sum Squared Residuals | 69669.5946060655 |
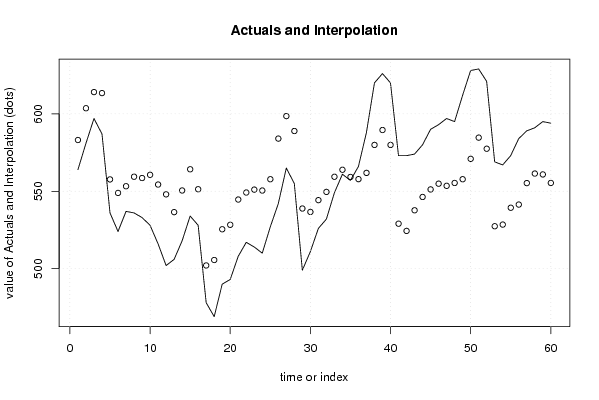
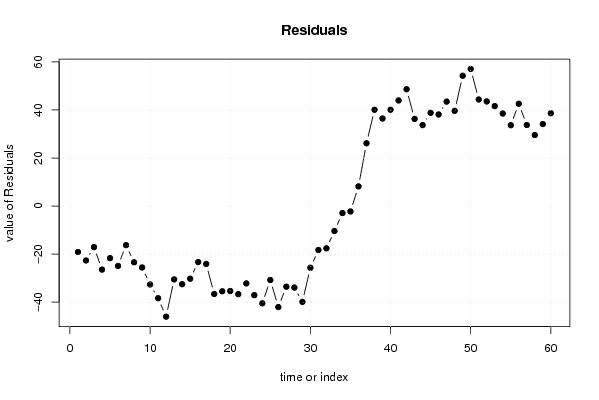
| Multiple Linear Regression - Actuals, Interpolation, and Residuals | |||
| Time or Index | Actuals | Interpolation Forecast | Residuals Prediction Error |
| 1 | 564 | 583.105106508717 | -19.1051065087171 |
| 2 | 581 | 603.630391919843 | -22.6303919198431 |
| 3 | 597 | 614.06859000188 | -17.0685900018803 |
| 4 | 587 | 613.425347194241 | -26.4253471942407 |
| 5 | 536 | 557.647809385661 | -21.6478093856610 |
| 6 | 524 | 548.908469659118 | -24.9084696591184 |
| 7 | 537 | 553.242162946249 | -16.2421629462487 |
| 8 | 536 | 559.386547398394 | -23.3865473983936 |
| 9 | 533 | 558.541021301743 | -25.5410213017433 |
| 10 | 528 | 560.615735890617 | -32.615735890617 |
| 11 | 516 | 554.328648561528 | -38.3286485615279 |
| 12 | 502 | 548.005044725602 | -46.0050447256024 |
| 13 | 506 | 536.512310957101 | -30.512310957101 |
| 14 | 518 | 550.498256641685 | -32.4982566416848 |
| 15 | 534 | 564.206124586993 | -30.2061245869933 |
| 16 | 528 | 551.301619792086 | -23.3016197920864 |
| 17 | 478 | 502.063421710049 | -24.0634217100492 |
| 18 | 469 | 505.585343970774 | -36.5853439707739 |
| 19 | 490 | 525.449969108443 | -35.4499691084428 |
| 20 | 493 | 528.324683697316 | -35.3246836973165 |
| 21 | 508 | 544.64492438284 | -36.6449243828404 |
| 22 | 517 | 549.171891369167 | -32.1718913691675 |
| 23 | 514 | 551.058978698257 | -37.0589786982567 |
| 24 | 510 | 550.457297123056 | -40.4572971230559 |
| 25 | 527 | 557.765165068364 | -30.7651650683643 |
| 26 | 542 | 584.012372740215 | -42.0123727402154 |
| 27 | 565 | 598.537658151342 | -33.5376581513417 |
| 28 | 555 | 588.902823219706 | -33.9028232197061 |
| 29 | 499 | 538.847207671851 | -39.847207671851 |
| 30 | 511 | 536.647207671851 | -25.6472076718511 |
| 31 | 526 | 544.250570822253 | -18.2505708222527 |
| 32 | 532 | 549.57753780858 | -17.5775378085798 |
| 33 | 549 | 559.358438767561 | -10.3584387675612 |
| 34 | 561 | 563.885405753888 | -2.8854057538883 |
| 35 | 557 | 559.233153356435 | -2.23315335643485 |
| 36 | 566 | 557.814054315416 | 8.18594568458379 |
| 37 | 588 | 561.852252397453 | 26.1477476025466 |
| 38 | 620 | 579.925285411126 | 40.0747145888737 |
| 39 | 626 | 589.546066027346 | 36.4539339726543 |
| 40 | 620 | 579.91123109571 | 40.0887689042899 |
| 41 | 573 | 529.038198082037 | 43.9618019179628 |
| 42 | 573 | 524.385945684584 | 48.6140543154162 |
| 43 | 574 | 537.71123109571 | 36.2887689042899 |
| 44 | 580 | 546.307867945309 | 33.6921320546915 |
| 45 | 590 | 551.184264109383 | 38.815735890617 |
| 46 | 593 | 554.893813629892 | 38.1061863701077 |
| 47 | 597 | 553.51123109571 | 43.4887689042899 |
| 48 | 595 | 555.361801917963 | 39.6381980820372 |
| 49 | 612 | 557.765165068364 | 54.2348349316357 |
| 50 | 628 | 570.93369328713 | 57.0663067128697 |
| 51 | 629 | 584.641561232439 | 44.3584387675612 |
| 52 | 621 | 577.458978698257 | 43.5410213017433 |
| 53 | 569 | 527.403363150402 | 41.5966368495984 |
| 54 | 567 | 528.473033013673 | 38.5269669863271 |
| 55 | 573 | 539.346066027346 | 33.6539339726543 |
| 56 | 584 | 541.403363150402 | 42.5966368495984 |
| 57 | 589 | 555.271351438472 | 33.7286485615279 |
| 58 | 591 | 561.433153356435 | 29.5668466435652 |
| 59 | 595 | 560.86798828807 | 34.1320117119295 |
| 60 | 594 | 555.361801917963 | 38.6381980820372 |
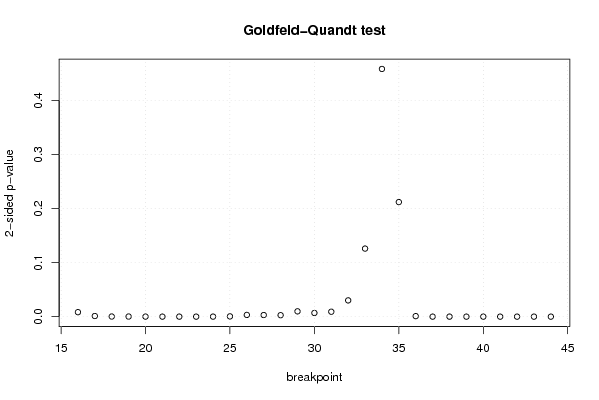
| Goldfeld-Quandt test for Heteroskedasticity | |||
| p-values | Alternative Hypothesis | ||
| breakpoint index | greater | 2-sided | less |
| 16 | 0.00415037466664197 | 0.00830074933328394 | 0.995849625333358 |
| 17 | 0.000583351216898594 | 0.00116670243379719 | 0.999416648783101 |
| 18 | 0.000108663195959247 | 0.000217326391918494 | 0.99989133680404 |
| 19 | 9.22595830294697e-05 | 0.000184519166058939 | 0.99990774041697 |
| 20 | 2.88810563720328e-05 | 5.77621127440656e-05 | 0.999971118943628 |
| 21 | 1.36370213994757e-05 | 2.72740427989514e-05 | 0.9999863629786 |
| 22 | 6.77336906762662e-06 | 1.35467381352532e-05 | 0.999993226630932 |
| 23 | 5.64301710395524e-06 | 1.12860342079105e-05 | 0.999994356982896 |
| 24 | 2.56100458012116e-05 | 5.12200916024231e-05 | 0.9999743899542 |
| 25 | 0.000240832257044868 | 0.000481664514089736 | 0.999759167742955 |
| 26 | 0.00159554431201641 | 0.00319108862403282 | 0.998404455687984 |
| 27 | 0.00147626325148597 | 0.00295252650297194 | 0.998523736748514 |
| 28 | 0.00134602097149987 | 0.00269204194299974 | 0.9986539790285 |
| 29 | 0.00492209373514541 | 0.00984418747029082 | 0.995077906264855 |
| 30 | 0.00342254380991250 | 0.00684508761982499 | 0.996577456190088 |
| 31 | 0.00455743000058861 | 0.00911486000117721 | 0.995442569999411 |
| 32 | 0.0150464810468403 | 0.0300929620936805 | 0.98495351895316 |
| 33 | 0.0629248818180869 | 0.125849763636174 | 0.937075118181913 |
| 34 | 0.228993733214701 | 0.457987466429402 | 0.771006266785299 |
| 35 | 0.894069550610718 | 0.211860898778565 | 0.105930449389282 |
| 36 | 0.999530752273662 | 0.000938495452675676 | 0.000469247726337838 |
| 37 | 0.999999991153538 | 1.76929241069276e-08 | 8.84646205346381e-09 |
| 38 | 0.999999995790936 | 8.41812861216765e-09 | 4.20906430608383e-09 |
| 39 | 0.999999981947267 | 3.61054652711620e-08 | 1.80527326355810e-08 |
| 40 | 0.999999892235788 | 2.15528424826655e-07 | 1.07764212413328e-07 |
| 41 | 0.999999885839264 | 2.28321472155226e-07 | 1.14160736077613e-07 |
| 42 | 0.999999942339378 | 1.15321244310672e-07 | 5.76606221553361e-08 |
| 43 | 0.999998290342012 | 3.41931597681473e-06 | 1.70965798840737e-06 |
| 44 | 0.999996678780829 | 6.64243834242217e-06 | 3.32121917121109e-06 |
| Meta Analysis of Goldfeld-Quandt test for Heteroskedasticity | |||
| Description | # significant tests | % significant tests | OK/NOK |
| 1% type I error level | 25 | 0.862068965517241 | NOK |
| 5% type I error level | 26 | 0.896551724137931 | NOK |
| 10% type I error level | 26 | 0.896551724137931 | NOK |