| Multiple Linear Regression - Estimated Regression Equation |
| WLH[t] = + 9.04393654328443 + 4.53773313169803X[t] + 0.875770345031125`Y(t-1)`[t] + 0.572726124650886M1[t] + 5.40250397789863M2[t] + 6.35281382996584M3[t] + 5.05219926799572M4[t] + 3.00250912006294M5[t] + 4.52920559318618M6[t] + 0.704361376247183M7[t] + 7.83229040142024M8[t] + 37.9292107353505M9[t] + 16.7281747873532M10[t] + 8.2890049078007M11[t] -0.122998816973845t + e[t] |
| Multiple Linear Regression - Ordinary Least Squares | |||||
| Variable | Parameter | S.D. | T-STAT H0: parameter = 0 | 2-tail p-value | 1-tail p-value |
| (Intercept) | 9.04393654328443 | 8.295615 | 1.0902 | 0.281557 | 0.140778 |
| X | 4.53773313169803 | 1.302917 | 3.4828 | 0.001134 | 0.000567 |
| `Y(t-1)` | 0.875770345031125 | 0.051729 | 16.9299 | 0 | 0 |
| M1 | 0.572726124650886 | 1.665996 | 0.3438 | 0.732654 | 0.366327 |
| M2 | 5.40250397789863 | 1.828325 | 2.9549 | 0.005009 | 0.002504 |
| M3 | 6.35281382996584 | 1.885266 | 3.3697 | 0.001574 | 0.000787 |
| M4 | 5.05219926799572 | 1.912227 | 2.6421 | 0.011368 | 0.005684 |
| M5 | 3.00250912006294 | 1.976694 | 1.519 | 0.135927 | 0.067964 |
| M6 | 4.52920559318618 | 2.105413 | 2.1512 | 0.036989 | 0.018495 |
| M7 | 0.704361376247183 | 2.174117 | 0.324 | 0.747491 | 0.373746 |
| M8 | 7.83229040142024 | 2.380574 | 3.2901 | 0.001977 | 0.000989 |
| M9 | 37.9292107353505 | 2.297326 | 16.5102 | 0 | 0 |
| M10 | 16.7281747873532 | 1.597106 | 10.4741 | 0 | 0 |
| M11 | 8.2890049078007 | 1.60831 | 5.1539 | 6e-06 | 3e-06 |
| t | -0.122998816973845 | 0.050641 | -2.4288 | 0.019302 | 0.009651 |
| Multiple Linear Regression - Regression Statistics | |
| Multiple R | 0.992953343119385 |
| R-squared | 0.985956341611964 |
| Adjusted R-squared | 0.981487904852134 |
| F-TEST (value) | 220.649053484545 |
| F-TEST (DF numerator) | 14 |
| F-TEST (DF denominator) | 44 |
| p-value | 0 |
| Multiple Linear Regression - Residual Statistics | |
| Residual Standard Deviation | 2.37014623783598 |
| Sum Squared Residuals | 247.174100304034 |
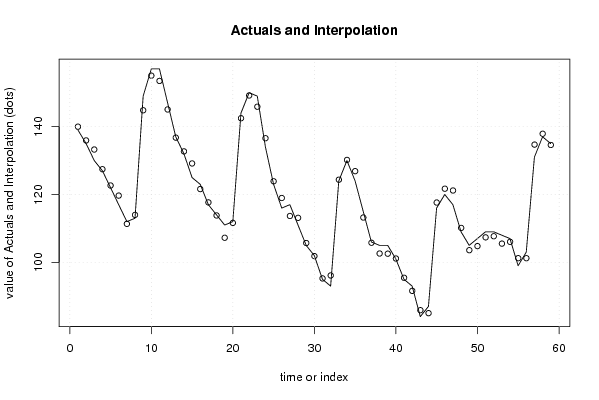
| Multiple Linear Regression - Actuals, Interpolation, and Residuals | |||
| Time or Index | Actuals | Interpolation Forecast | Residuals Prediction Error |
| 1 | 139 | 139.983445260599 | -0.983445260599118 |
| 2 | 135 | 135.932520846562 | -0.93252084656179 |
| 3 | 130 | 133.256750501531 | -3.25675050153071 |
| 4 | 127 | 127.454285397431 | -0.454285397431072 |
| 5 | 122 | 122.654285397431 | -0.654285397431074 |
| 6 | 117 | 119.679131328425 | -2.67913132842486 |
| 7 | 112 | 111.352436569356 | 0.647563430643625 |
| 8 | 113 | 113.9785150524 | -0.978515052399952 |
| 9 | 149 | 144.828206914387 | 4.17179308561251 |
| 10 | 157 | 155.031904570537 | 1.9680954294631 |
| 11 | 157 | 153.475898634260 | 3.52410136574045 |
| 12 | 147 | 145.063894909485 | 1.93610509051501 |
| 13 | 137 | 136.755918766851 | 0.244081233149242 |
| 14 | 132 | 132.704994352813 | -0.704994352813419 |
| 15 | 125 | 129.153453662751 | -4.15345366275116 |
| 16 | 123 | 121.599447868589 | 1.40055213141069 |
| 17 | 117 | 117.675218213620 | -0.675218213620437 |
| 18 | 114 | 113.824293799583 | 0.175706200416914 |
| 19 | 111 | 107.249139730577 | 3.75086026942314 |
| 20 | 112 | 111.626758903683 | 0.373241096317314 |
| 21 | 144 | 142.476450765670 | 1.52354923432977 |
| 22 | 150 | 149.177067041695 | 0.822932958304861 |
| 23 | 149 | 145.869520415356 | 3.13047958464447 |
| 24 | 134 | 136.581746345550 | -2.58174634554986 |
| 25 | 123 | 123.89491847776 | -0.894918477760012 |
| 26 | 116 | 118.968223718692 | -2.96822371869152 |
| 27 | 117 | 113.665142338567 | 3.33485766143299 |
| 28 | 111 | 113.117299304654 | -2.11729930465417 |
| 29 | 105 | 105.689988269561 | -0.689988269560793 |
| 30 | 102 | 101.839063855523 | 0.160936144476559 |
| 31 | 95 | 95.2639097865172 | -0.263909786517211 |
| 32 | 93 | 96.1384475794985 | -3.13844757949854 |
| 33 | 124 | 124.360828406393 | -0.360828406392718 |
| 34 | 130 | 130.185674337386 | -0.185674337386484 |
| 35 | 124 | 126.878127711047 | -2.87812771104688 |
| 36 | 115 | 113.211501916086 | 1.78849808391442 |
| 37 | 106 | 105.779296118482 | 0.220703881517516 |
| 38 | 105 | 102.604142049476 | 2.39585795052375 |
| 39 | 105 | 102.555682739538 | 2.44431726046151 |
| 40 | 101 | 101.132069360595 | -0.132069360594526 |
| 41 | 95 | 95.4562990155634 | -0.456299015563395 |
| 42 | 93 | 91.605374601526 | 1.39462539847396 |
| 43 | 84 | 85.905990877551 | -1.90599087755094 |
| 44 | 87 | 85.02898798047 | 1.97101201952998 |
| 45 | 116 | 117.630220532520 | -1.63022053251982 |
| 46 | 120 | 121.703525773451 | -1.70352577345134 |
| 47 | 117 | 121.182171588748 | -4.18217158874752 |
| 48 | 109 | 110.142856828880 | -1.14285682887959 |
| 49 | 105 | 103.586421376308 | 1.41357862369237 |
| 50 | 107 | 104.790119032457 | 2.20988096754298 |
| 51 | 109 | 107.368970757613 | 1.63102924238736 |
| 52 | 109 | 107.696898068731 | 1.30310193126908 |
| 53 | 108 | 105.524209103824 | 2.47579089617570 |
| 54 | 107 | 106.052136414943 | 0.947863585057428 |
| 55 | 99 | 101.228523035999 | -2.22852303599861 |
| 56 | 103 | 101.227290483949 | 1.77270951605119 |
| 57 | 131 | 134.704293381030 | -3.70429338102974 |
| 58 | 137 | 137.901828276930 | -0.90182827693013 |
| 59 | 135 | 134.594281650591 | 0.405718349409481 |
| Goldfeld-Quandt test for Heteroskedasticity | |||
| p-values | Alternative Hypothesis | ||
| breakpoint index | greater | 2-sided | less |
| 18 | 0.110959151241921 | 0.221918302483842 | 0.889040848758079 |
| 19 | 0.136760804843620 | 0.273521609687240 | 0.86323919515638 |
| 20 | 0.0711040777759339 | 0.142208155551868 | 0.928895922224066 |
| 21 | 0.109139950039461 | 0.218279900078922 | 0.890860049960539 |
| 22 | 0.132874972275792 | 0.265749944551584 | 0.867125027724208 |
| 23 | 0.256221116978536 | 0.512442233957071 | 0.743778883021464 |
| 24 | 0.430223969880825 | 0.86044793976165 | 0.569776030119175 |
| 25 | 0.338880329851945 | 0.67776065970389 | 0.661119670148055 |
| 26 | 0.383741852293647 | 0.767483704587294 | 0.616258147706353 |
| 27 | 0.858813804741692 | 0.282372390516616 | 0.141186195258308 |
| 28 | 0.864751706065631 | 0.270496587868738 | 0.135248293934369 |
| 29 | 0.809143750225587 | 0.381712499548825 | 0.190856249774413 |
| 30 | 0.731917225779401 | 0.536165548441198 | 0.268082774220599 |
| 31 | 0.760385488832535 | 0.47922902233493 | 0.239614511167465 |
| 32 | 0.911537856755153 | 0.176924286489694 | 0.0884621432448469 |
| 33 | 0.940433569775867 | 0.119132860448265 | 0.0595664302241325 |
| 34 | 0.969888604370989 | 0.0602227912580224 | 0.0301113956290112 |
| 35 | 0.964631151664008 | 0.070737696671983 | 0.0353688483359915 |
| 36 | 0.99006505702362 | 0.0198698859527617 | 0.00993494297638086 |
| 37 | 0.977217217251874 | 0.0455655654962523 | 0.0227827827481262 |
| 38 | 0.968492629857846 | 0.0630147402843084 | 0.0315073701421542 |
| 39 | 0.985588094490518 | 0.028823811018965 | 0.0144119055094825 |
| 40 | 0.985855279560222 | 0.0282894408795567 | 0.0141447204397784 |
| 41 | 0.950218270540348 | 0.0995634589193043 | 0.0497817294596522 |
| Meta Analysis of Goldfeld-Quandt test for Heteroskedasticity | |||
| Description | # significant tests | % significant tests | OK/NOK |
| 1% type I error level | 0 | 0 | OK |
| 5% type I error level | 4 | 0.166666666666667 | NOK |
| 10% type I error level | 8 | 0.333333333333333 | NOK |