| Multiple Linear Regression - Estimated Regression Equation |
| werklh[t] = + 8.47966411761748 -0.138668089218583inflatie[t] + e[t] |
| Multiple Linear Regression - Ordinary Least Squares | |||||
| Variable | Parameter | S.D. | T-STAT H0: parameter = 0 | 2-tail p-value | 1-tail p-value |
| (Intercept) | 8.47966411761748 | 0.29349 | 28.8926 | 0 | 0 |
| inflatie | -0.138668089218583 | 0.062785 | -2.2086 | 0.031167 | 0.015584 |
| Multiple Linear Regression - Regression Statistics | |
| Multiple R | 0.278528953951772 |
| R-squared | 0.0775783781894685 |
| Adjusted R-squared | 0.0616745571237698 |
| F-TEST (value) | 4.87797101520393 |
| F-TEST (DF numerator) | 1 |
| F-TEST (DF denominator) | 58 |
| p-value | 0.0311670609145538 |
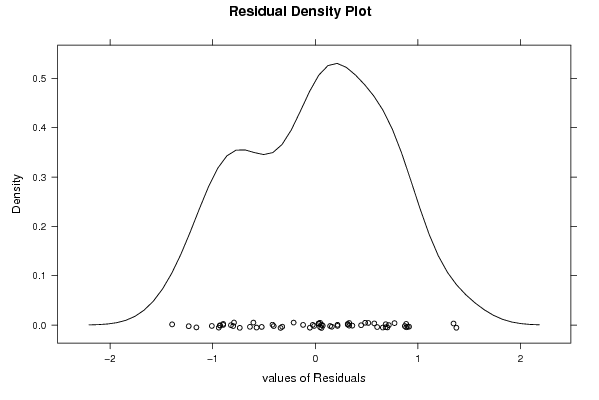
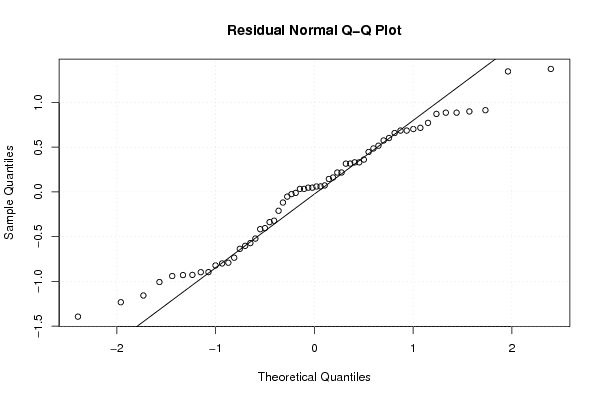
| Multiple Linear Regression - Residual Statistics | |
| Residual Standard Deviation | 0.685903917563281 |
| Sum Squared Residuals | 27.2869226794620 |
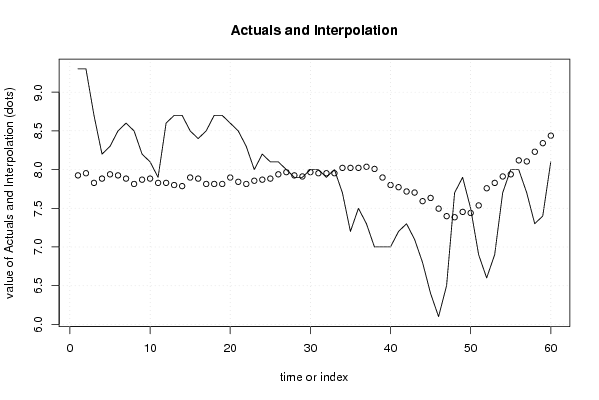
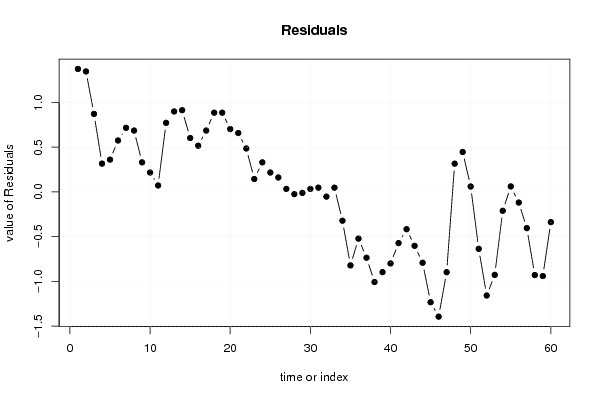
| Multiple Linear Regression - Actuals, Interpolation, and Residuals | |||
| Time or Index | Actuals | Interpolation Forecast | Residuals Prediction Error |
| 1 | 9.3 | 7.9249917607432 | 1.37500823925680 |
| 2 | 9.3 | 7.95272537858687 | 1.34727462141313 |
| 3 | 8.7 | 7.82792409829014 | 0.872075901709855 |
| 4 | 8.2 | 7.88339133397758 | 0.316608666022422 |
| 5 | 8.3 | 7.93885856966501 | 0.36114143033499 |
| 6 | 8.5 | 7.92499176074315 | 0.575008239256848 |
| 7 | 8.6 | 7.88339133397758 | 0.716608666022422 |
| 8 | 8.5 | 7.81405728936829 | 0.685942710631714 |
| 9 | 8.2 | 7.86952452505572 | 0.330475474944280 |
| 10 | 8.1 | 7.88339133397758 | 0.216608666022422 |
| 11 | 7.9 | 7.82792409829014 | 0.0720759017098564 |
| 12 | 8.6 | 7.82792409829014 | 0.772075901709856 |
| 13 | 8.7 | 7.80019048044643 | 0.899809519553572 |
| 14 | 8.7 | 7.78632367152457 | 0.91367632847543 |
| 15 | 8.5 | 7.89725814289944 | 0.602741857100564 |
| 16 | 8.4 | 7.88339133397758 | 0.516608666022423 |
| 17 | 8.5 | 7.81405728936829 | 0.685942710631714 |
| 18 | 8.7 | 7.81405728936829 | 0.885942710631714 |
| 19 | 8.7 | 7.81405728936829 | 0.885942710631714 |
| 20 | 8.6 | 7.89725814289944 | 0.702741857100564 |
| 21 | 8.5 | 7.841790907212 | 0.658209092787998 |
| 22 | 8.3 | 7.81405728936829 | 0.485942710631715 |
| 23 | 8 | 7.85565771613386 | 0.144342283866139 |
| 24 | 8.2 | 7.86952452505572 | 0.330475474944280 |
| 25 | 8.1 | 7.88339133397758 | 0.216608666022422 |
| 26 | 8.1 | 7.93885856966501 | 0.161141430334989 |
| 27 | 8 | 7.96659218750873 | 0.0334078124912729 |
| 28 | 7.9 | 7.92499176074315 | -0.0249917607431518 |
| 29 | 7.9 | 7.9111249518213 | -0.0111249518212935 |
| 30 | 8 | 7.96659218750873 | 0.0334078124912729 |
| 31 | 8 | 7.95272537858687 | 0.0472746214131312 |
| 32 | 7.9 | 7.95272537858687 | -0.0527253785868685 |
| 33 | 8 | 7.95272537858687 | 0.0472746214131312 |
| 34 | 7.7 | 8.02205942319616 | -0.32205942319616 |
| 35 | 7.2 | 8.02205942319616 | -0.82205942319616 |
| 36 | 7.5 | 8.02205942319616 | -0.52205942319616 |
| 37 | 7.3 | 8.03592623211802 | -0.735926232118019 |
| 38 | 7 | 8.0081926142743 | -1.00819261427430 |
| 39 | 7 | 7.89725814289944 | -0.897258142899436 |
| 40 | 7 | 7.80019048044643 | -0.800190480446427 |
| 41 | 7.2 | 7.77245686260271 | -0.57245686260271 |
| 42 | 7.3 | 7.71698962691528 | -0.416989626915278 |
| 43 | 7.1 | 7.70312281799342 | -0.60312281799342 |
| 44 | 6.8 | 7.59218834661855 | -0.792188346618553 |
| 45 | 6.4 | 7.63378877338413 | -1.23378877338413 |
| 46 | 6.1 | 7.49512068416554 | -1.39512068416554 |
| 47 | 6.5 | 7.39805302171254 | -0.898053021712536 |
| 48 | 7.7 | 7.38418621279068 | 0.315813787209322 |
| 49 | 7.9 | 7.45352025739997 | 0.446479742600031 |
| 50 | 7.5 | 7.43965344847811 | 0.060346551521889 |
| 51 | 6.9 | 7.53672111093112 | -0.636721110931119 |
| 52 | 6.6 | 7.75859005368085 | -1.15859005368085 |
| 53 | 6.9 | 7.82792409829014 | -0.927924098290144 |
| 54 | 7.7 | 7.9111249518213 | -0.211124951821294 |
| 55 | 8 | 7.93885856966501 | 0.0611414303349895 |
| 56 | 8 | 8.11912708564917 | -0.119127085649169 |
| 57 | 7.7 | 8.10526027672731 | -0.40526027672731 |
| 58 | 7.3 | 8.23006155702403 | -0.930061557024036 |
| 59 | 7.4 | 8.3409960283989 | -0.940996028398901 |
| 60 | 8.1 | 8.43806369085191 | -0.33806369085191 |
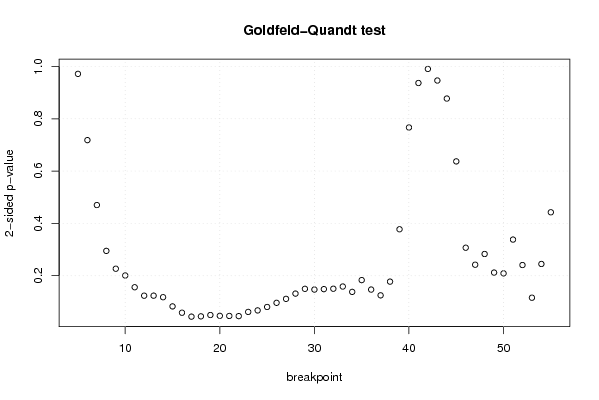
| Goldfeld-Quandt test for Heteroskedasticity | |||
| p-values | Alternative Hypothesis | ||
| breakpoint index | greater | 2-sided | less |
| 5 | 0.485759258889777 | 0.971518517779554 | 0.514240741110223 |
| 6 | 0.359127784370548 | 0.718255568741096 | 0.640872215629452 |
| 7 | 0.235045267437659 | 0.470090534875318 | 0.764954732562341 |
| 8 | 0.147447124229219 | 0.294894248458438 | 0.852552875770781 |
| 9 | 0.113342992258041 | 0.226685984516082 | 0.886657007741959 |
| 10 | 0.100421067465155 | 0.200842134930311 | 0.899578932534845 |
| 11 | 0.0779309792540824 | 0.155861958508165 | 0.922069020745918 |
| 12 | 0.0618078408575336 | 0.123615681715067 | 0.938192159142466 |
| 13 | 0.0618409912998893 | 0.123681982599779 | 0.93815900870011 |
| 14 | 0.0589000734925011 | 0.117800146985002 | 0.941099926507499 |
| 15 | 0.0413474379295297 | 0.0826948758590594 | 0.95865256207047 |
| 16 | 0.0292289735736949 | 0.0584579471473898 | 0.970771026426305 |
| 17 | 0.0217389043813737 | 0.0434778087627474 | 0.978261095618626 |
| 18 | 0.0223008153360601 | 0.0446016306721201 | 0.97769918466394 |
| 19 | 0.0248011491672760 | 0.0496022983345521 | 0.975198850832724 |
| 20 | 0.0233158429280902 | 0.0466316858561805 | 0.97668415707191 |
| 21 | 0.0230802053973736 | 0.0461604107947471 | 0.976919794602626 |
| 22 | 0.0227834017065860 | 0.0455668034131721 | 0.977216598293414 |
| 23 | 0.0307670668069358 | 0.0615341336138716 | 0.969232933193064 |
| 24 | 0.0336732531315486 | 0.0673465062630972 | 0.966326746868451 |
| 25 | 0.0402159380168549 | 0.0804318760337098 | 0.959784061983145 |
| 26 | 0.0481772022298766 | 0.0963544044597532 | 0.951822797770123 |
| 27 | 0.0557252207218135 | 0.111450441443627 | 0.944274779278186 |
| 28 | 0.0658075437872568 | 0.131615087574514 | 0.934192456212743 |
| 29 | 0.0749077285544582 | 0.149815457108916 | 0.925092271445542 |
| 30 | 0.0735247916175015 | 0.147049583235003 | 0.926475208382499 |
| 31 | 0.0743483547859806 | 0.148696709571961 | 0.92565164521402 |
| 32 | 0.0751118875619367 | 0.150223775123873 | 0.924888112438063 |
| 33 | 0.0793237348895843 | 0.158647469779169 | 0.920676265110416 |
| 34 | 0.0690921264372827 | 0.138184252874565 | 0.930907873562717 |
| 35 | 0.0916060418443307 | 0.183212083688661 | 0.90839395815567 |
| 36 | 0.073500167866601 | 0.147000335733202 | 0.926499832133399 |
| 37 | 0.0624958789560139 | 0.124991757912028 | 0.937504121043986 |
| 38 | 0.0886837275033339 | 0.177367455006668 | 0.911316272496666 |
| 39 | 0.188749201387963 | 0.377498402775926 | 0.811250798612037 |
| 40 | 0.383317266244393 | 0.766634532488785 | 0.616682733755607 |
| 41 | 0.468328775825939 | 0.936657551651878 | 0.531671224174061 |
| 42 | 0.504818299384851 | 0.990363401230297 | 0.495181700615149 |
| 43 | 0.526941343159022 | 0.946117313681957 | 0.473058656840978 |
| 44 | 0.561387888702741 | 0.877224222594517 | 0.438612111297259 |
| 45 | 0.681512948082881 | 0.636974103834238 | 0.318487051917119 |
| 46 | 0.846501969464057 | 0.306996061071887 | 0.153498030535943 |
| 47 | 0.879039273035944 | 0.241921453928112 | 0.120960726964056 |
| 48 | 0.858496162482561 | 0.283007675034878 | 0.141503837517439 |
| 49 | 0.894027215510847 | 0.211945568978306 | 0.105972784489153 |
| 50 | 0.895484952620254 | 0.209030094759493 | 0.104515047379746 |
| 51 | 0.830931370546218 | 0.338137258907565 | 0.169068629453782 |
| 52 | 0.879639389823297 | 0.240721220353407 | 0.120360610176703 |
| 53 | 0.942079456857742 | 0.115841086284516 | 0.057920543142258 |
| 54 | 0.877561490809406 | 0.244877018381187 | 0.122438509190593 |
| 55 | 0.778762261174682 | 0.442475477650636 | 0.221237738825318 |
| Meta Analysis of Goldfeld-Quandt test for Heteroskedasticity | |||
| Description | # significant tests | % significant tests | OK/NOK |
| 1% type I error level | 0 | 0 | OK |
| 5% type I error level | 6 | 0.117647058823529 | NOK |
| 10% type I error level | 12 | 0.235294117647059 | NOK |