| Multiple Linear Regression - Estimated Regression Equation |
| werklh[t] = + 11.1601866545664 -0.0358960522927116ecogr[t] + 0.667880943329111M1[t] + 1.06201420144467M2[t] + 0.757706675169545M3[t] + 0.32438233526692M4[t] + 0.190854416796458M5[t] + 0.478751548300854M6[t] + 0.566134337327233M7[t] + 0.762019597503095M8[t] + 0.340181994334138M9[t] + 0.0600802050502195M10[t] + 0.291041807189020M11[t] + e[t] |
| Multiple Linear Regression - Ordinary Least Squares | |||||
| Variable | Parameter | S.D. | T-STAT H0: parameter = 0 | 2-tail p-value | 1-tail p-value |
| (Intercept) | 11.1601866545664 | 1.425609 | 7.8284 | 0 | 0 |
| ecogr | -0.0358960522927116 | 0.015895 | -2.2583 | 0.028608 | 0.014304 |
| M1 | 0.667880943329111 | 0.483396 | 1.3816 | 0.173614 | 0.086807 |
| M2 | 1.06201420144467 | 0.615822 | 1.7245 | 0.091181 | 0.045591 |
| M3 | 0.757706675169545 | 0.614505 | 1.233 | 0.223694 | 0.111847 |
| M4 | 0.32438233526692 | 0.548326 | 0.5916 | 0.556962 | 0.278481 |
| M5 | 0.190854416796458 | 0.487473 | 0.3915 | 0.697184 | 0.348592 |
| M6 | 0.478751548300854 | 0.488916 | 0.9792 | 0.332489 | 0.166245 |
| M7 | 0.566134337327233 | 0.497999 | 1.1368 | 0.261377 | 0.130689 |
| M8 | 0.762019597503095 | 0.574688 | 1.326 | 0.191257 | 0.095629 |
| M9 | 0.340181994334138 | 0.518077 | 0.6566 | 0.514625 | 0.257312 |
| M10 | 0.0600802050502195 | 0.513568 | 0.117 | 0.90737 | 0.453685 |
| M11 | 0.291041807189020 | 0.600431 | 0.4847 | 0.630125 | 0.315063 |
| Multiple Linear Regression - Regression Statistics | |
| Multiple R | 0.463074144446394 |
| R-squared | 0.21443766325476 |
| Adjusted R-squared | 0.0138685560006561 |
| F-TEST (value) | 1.06914602248833 |
| F-TEST (DF numerator) | 12 |
| F-TEST (DF denominator) | 47 |
| p-value | 0.406474500246614 |
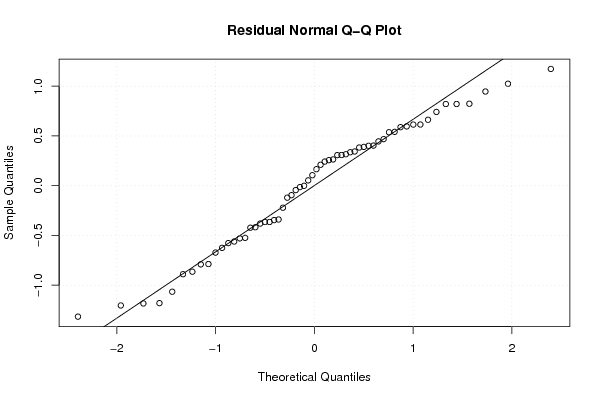
| Multiple Linear Regression - Residual Statistics | |
| Residual Standard Deviation | 0.703159648930356 |
| Sum Squared Residuals | 23.2383741185415 |
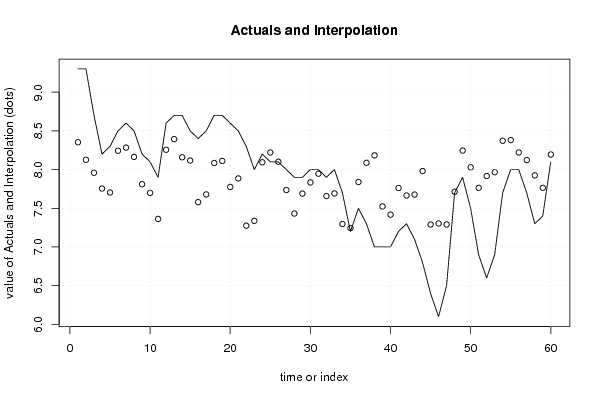
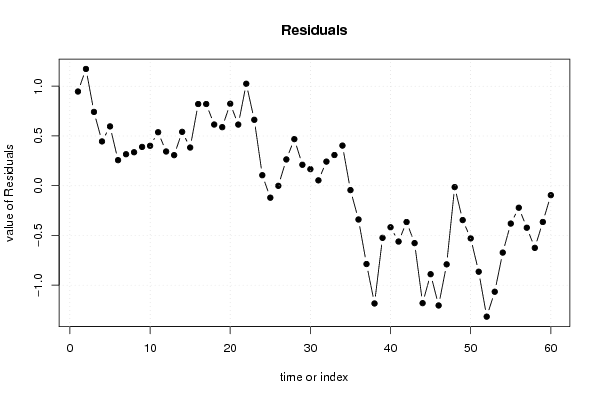
| Multiple Linear Regression - Actuals, Interpolation, and Residuals | |||
| Time or Index | Actuals | Interpolation Forecast | Residuals Prediction Error |
| 1 | 9.3 | 8.3533297359611 | 0.946670264038907 |
| 2 | 9.3 | 8.12646128941269 | 1.17353871058731 |
| 3 | 8.7 | 7.95855876184987 | 0.741441238150132 |
| 4 | 8.2 | 7.7549691566206 | 0.445030843379403 |
| 5 | 8.3 | 7.70400215842337 | 0.59599784157663 |
| 6 | 8.5 | 8.24317165597675 | 0.256828344023252 |
| 7 | 8.6 | 8.2838895770226 | 0.316110422977398 |
| 8 | 8.5 | 8.1638895770226 | 0.336110422977398 |
| 9 | 8.2 | 7.8102544732098 | 0.389745526790203 |
| 10 | 8.1 | 7.69886412970162 | 0.401135870298378 |
| 11 | 7.9 | 7.36266810561558 | 0.53733189438442 |
| 12 | 8.6 | 8.25619602408604 | 0.343803975913958 |
| 13 | 8.7 | 8.39281539348302 | 0.307184606516977 |
| 14 | 8.7 | 8.15876773647613 | 0.541232263523871 |
| 15 | 8.5 | 8.1165013919378 | 0.383498608062202 |
| 16 | 8.4 | 7.57907850038631 | 0.820921499613692 |
| 17 | 8.5 | 7.67887492181847 | 0.821125078181528 |
| 18 | 8.7 | 8.08522902588882 | 0.614770974111183 |
| 19 | 8.7 | 8.11158852601759 | 0.588411473982413 |
| 20 | 8.6 | 7.77621221226132 | 0.823787787738683 |
| 21 | 8.5 | 7.88563618302449 | 0.61436381697551 |
| 22 | 8.3 | 7.27529071264763 | 1.02470928735238 |
| 23 | 8 | 7.33754086901068 | 0.662459130989318 |
| 24 | 8.2 | 8.09466378876884 | 0.105336211231159 |
| 25 | 8.1 | 8.22051434247801 | -0.120514342478007 |
| 26 | 8.1 | 8.10133405280779 | -0.00133405280779036 |
| 27 | 8 | 7.73600323763505 | 0.263996762364945 |
| 28 | 7.9 | 7.43190468598619 | 0.468095314013809 |
| 29 | 7.9 | 7.68964373750629 | 0.210356262493715 |
| 30 | 8 | 7.83395665983983 | 0.166043340160165 |
| 31 | 8 | 7.94646668547111 | 0.0535333145288874 |
| 32 | 7.9 | 7.65775523969537 | 0.242244760304632 |
| 33 | 8 | 7.69179750064385 | 0.308202499356152 |
| 34 | 7.7 | 7.29682834402325 | 0.403171655976748 |
| 35 | 7.2 | 7.24421113304963 | -0.0442111330496315 |
| 36 | 7.5 | 7.83980181749059 | -0.339801817490588 |
| 37 | 7.3 | 8.08769894899497 | -0.787698948994973 |
| 38 | 7 | 8.18389497308103 | -1.18389497308103 |
| 39 | 7 | 7.52421652910806 | -0.524216529108056 |
| 40 | 7 | 7.4175462650691 | -0.417546265069107 |
| 41 | 7.2 | 7.76143584209171 | -0.561435842091708 |
| 42 | 7.3 | 7.66524521406409 | -0.365245214064091 |
| 43 | 7.1 | 7.67724629327578 | -0.577246293275776 |
| 44 | 6.8 | 7.98081971032977 | -1.18081971032977 |
| 45 | 6.4 | 7.28976171496548 | -0.889761714965477 |
| 46 | 6.1 | 7.3040075544818 | -1.20400755448180 |
| 47 | 6.5 | 7.29087600103016 | -0.790876001030157 |
| 48 | 7.7 | 7.7141656344661 | -0.0141656344660969 |
| 49 | 7.9 | 8.2456415790829 | -0.345641579082904 |
| 50 | 7.5 | 8.02954194822237 | -0.529541948222367 |
| 51 | 6.9 | 7.76472007946922 | -0.864720079469223 |
| 52 | 6.6 | 7.9165013919378 | -1.31650139193780 |
| 53 | 6.9 | 7.96604334016016 | -1.06604334016016 |
| 54 | 7.7 | 8.37239744423051 | -0.672397444230509 |
| 55 | 8 | 8.38080891821292 | -0.380808918212923 |
| 56 | 8 | 8.22132326069094 | -0.221323260690941 |
| 57 | 7.7 | 8.12255012815639 | -0.422550128156387 |
| 58 | 7.3 | 7.9250092591457 | -0.625009259145706 |
| 59 | 7.4 | 7.76470389129395 | -0.36470389129395 |
| 60 | 8.1 | 8.19517273518843 | -0.0951727351884332 |
| Goldfeld-Quandt test for Heteroskedasticity | |||
| p-values | Alternative Hypothesis | ||
| breakpoint index | greater | 2-sided | less |
| 16 | 0.115094199162433 | 0.230188398324865 | 0.884905800837567 |
| 17 | 0.0512277867285024 | 0.102455573457005 | 0.948772213271498 |
| 18 | 0.0203797628783442 | 0.0407595257566883 | 0.979620237121656 |
| 19 | 0.0086104899816373 | 0.0172209799632746 | 0.991389510018363 |
| 20 | 0.00514965172994423 | 0.0102993034598885 | 0.994850348270056 |
| 21 | 0.00372060436294124 | 0.00744120872588248 | 0.99627939563706 |
| 22 | 0.00228060980378700 | 0.00456121960757401 | 0.997719390196213 |
| 23 | 0.00118932998137589 | 0.00237865996275179 | 0.998810670018624 |
| 24 | 0.00121902953897520 | 0.00243805907795040 | 0.998780970461025 |
| 25 | 0.0127284012551027 | 0.0254568025102054 | 0.987271598744897 |
| 26 | 0.0402010366076997 | 0.0804020732153994 | 0.9597989633923 |
| 27 | 0.0493313087649599 | 0.0986626175299198 | 0.95066869123504 |
| 28 | 0.0621916891983942 | 0.124383378396788 | 0.937808310801606 |
| 29 | 0.0812092781080408 | 0.162418556216082 | 0.918790721891959 |
| 30 | 0.0735844477333746 | 0.147168895466749 | 0.926415552266625 |
| 31 | 0.0654123053320155 | 0.130824610664031 | 0.934587694667985 |
| 32 | 0.0733338780810351 | 0.146667756162070 | 0.926666121918965 |
| 33 | 0.0925854152649433 | 0.185170830529887 | 0.907414584735057 |
| 34 | 0.265924611188881 | 0.531849222377762 | 0.734075388811119 |
| 35 | 0.322283840711904 | 0.644567681423808 | 0.677716159288096 |
| 36 | 0.283154201448110 | 0.566308402896221 | 0.71684579855189 |
| 37 | 0.395456062310683 | 0.790912124621367 | 0.604543937689317 |
| 38 | 0.72900139841382 | 0.541997203172359 | 0.270998601586180 |
| 39 | 0.68651360331455 | 0.626972793370899 | 0.313486396685450 |
| 40 | 0.845330423845355 | 0.30933915230929 | 0.154669576154645 |
| 41 | 0.87368313308349 | 0.252633733833019 | 0.126316866916509 |
| 42 | 0.890492957766166 | 0.219014084467667 | 0.109507042233834 |
| 43 | 0.816207597537539 | 0.367584804924923 | 0.183792402462461 |
| 44 | 0.960362050153879 | 0.0792758996922427 | 0.0396379498461213 |
| Meta Analysis of Goldfeld-Quandt test for Heteroskedasticity | |||
| Description | # significant tests | % significant tests | OK/NOK |
| 1% type I error level | 4 | 0.137931034482759 | NOK |
| 5% type I error level | 8 | 0.275862068965517 | NOK |
| 10% type I error level | 11 | 0.379310344827586 | NOK |