| Multiple Linear Regression - Estimated Regression Equation |
| werklh[t] = + 8.64886359752554 -0.152636795515909inflatie[t] + 0.337687549130172M1[t] + 0.191582077309546M2[t] -0.108417922690454M3[t] -0.335892545883318M4[t] -0.198945281793636M5[t] + 0.065791038654773M6[t] + 0.114949246385727M7[t] -0.0233671690761815M8[t] -0.229472640896818M9[t] -0.498630848627772M10[t] -0.598630848627772M11[t] + e[t] |
| Multiple Linear Regression - Ordinary Least Squares | |||||
| Variable | Parameter | S.D. | T-STAT H0: parameter = 0 | 2-tail p-value | 1-tail p-value |
| (Intercept) | 8.64886359752554 | 0.411208 | 21.0328 | 0 | 0 |
| inflatie | -0.152636795515909 | 0.06471 | -2.3588 | 0.022544 | 0.011272 |
| M1 | 0.337687549130172 | 0.444683 | 0.7594 | 0.451412 | 0.225706 |
| M2 | 0.191582077309546 | 0.44445 | 0.4311 | 0.668399 | 0.3342 |
| M3 | -0.108417922690454 | 0.44445 | -0.2439 | 0.808341 | 0.40417 |
| M4 | -0.335892545883318 | 0.443584 | -0.7572 | 0.452695 | 0.226348 |
| M5 | -0.198945281793636 | 0.443507 | -0.4486 | 0.655801 | 0.3279 |
| M6 | 0.065791038654773 | 0.443176 | 0.1485 | 0.88262 | 0.44131 |
| M7 | 0.114949246385727 | 0.443363 | 0.2593 | 0.796562 | 0.398281 |
| M8 | -0.0233671690761815 | 0.443023 | -0.0527 | 0.958159 | 0.479079 |
| M9 | -0.229472640896818 | 0.44294 | -0.5181 | 0.606841 | 0.303421 |
| M10 | -0.498630848627772 | 0.442843 | -1.126 | 0.265892 | 0.132946 |
| M11 | -0.598630848627772 | 0.442843 | -1.3518 | 0.182913 | 0.091456 |
| Multiple Linear Regression - Regression Statistics | |
| Multiple R | 0.470499971547118 |
| R-squared | 0.221370223225839 |
| Adjusted R-squared | 0.0225711312835001 |
| F-TEST (value) | 1.11353739628774 |
| F-TEST (DF numerator) | 12 |
| F-TEST (DF denominator) | 47 |
| p-value | 0.372158752790684 |
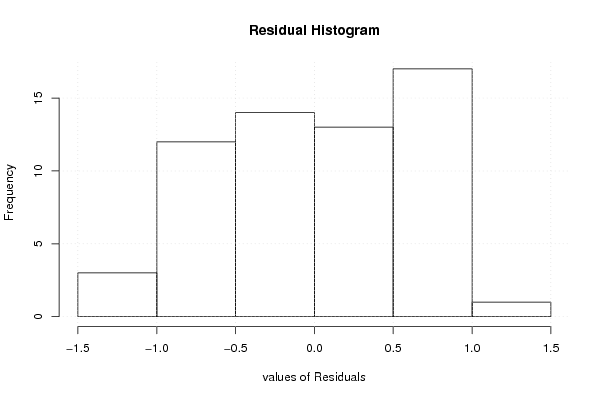
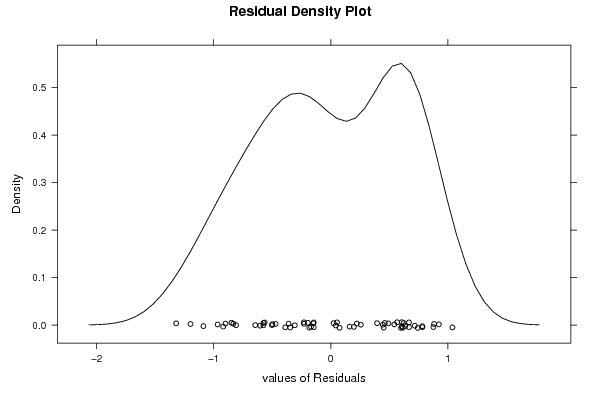
| Multiple Linear Regression - Residual Statistics | |
| Residual Standard Deviation | 0.700050093722839 |
| Sum Squared Residuals | 23.0332962849037 |
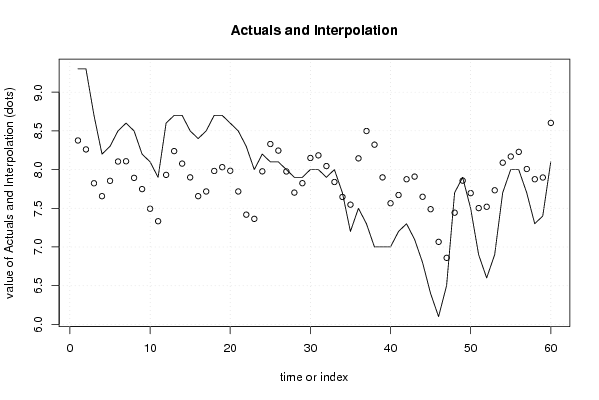
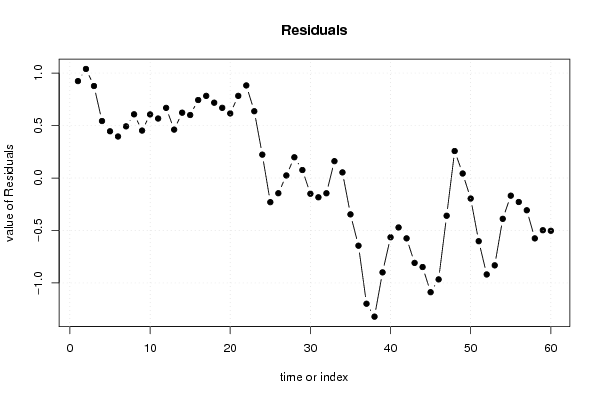
| Multiple Linear Regression - Actuals, Interpolation, and Residuals | |||
| Time or Index | Actuals | Interpolation Forecast | Residuals Prediction Error |
| 1 | 9.3 | 8.37600396459213 | 0.923996035407869 |
| 2 | 9.3 | 8.26042585187464 | 1.03957414812536 |
| 3 | 8.7 | 7.82305273591032 | 0.876947264089681 |
| 4 | 8.2 | 7.65663283092382 | 0.543367169076181 |
| 5 | 8.3 | 7.85463481321986 | 0.445365186780136 |
| 6 | 8.5 | 8.10410745411668 | 0.395892545883319 |
| 7 | 8.6 | 8.10747462319286 | 0.492525376807137 |
| 8 | 8.5 | 7.892839809973 | 0.607160190027 |
| 9 | 8.2 | 7.74778905635873 | 0.452210943641272 |
| 10 | 8.1 | 7.49389452817936 | 0.606105471820636 |
| 11 | 7.9 | 7.332839809973 | 0.567160190027 |
| 12 | 8.6 | 7.93147065860077 | 0.668529341399227 |
| 13 | 8.7 | 8.23863084862776 | 0.461369151372237 |
| 14 | 8.7 | 8.07726169725555 | 0.622738302744454 |
| 15 | 8.5 | 7.89937113366827 | 0.600628866331727 |
| 16 | 8.4 | 7.65663283092382 | 0.743367169076182 |
| 17 | 8.5 | 7.71726169725555 | 0.782738302744454 |
| 18 | 8.7 | 7.98199801770395 | 0.718001982296045 |
| 19 | 8.7 | 8.03115622543491 | 0.66884377456509 |
| 20 | 8.6 | 7.98442188728255 | 0.615578112717454 |
| 21 | 8.5 | 7.71726169725555 | 0.782738302744455 |
| 22 | 8.3 | 7.41757613042141 | 0.882423869578592 |
| 23 | 8 | 7.36336716907618 | 0.636632830923818 |
| 24 | 8.2 | 7.97726169725555 | 0.222738302744454 |
| 25 | 8.1 | 8.3302129259373 | -0.230212925937309 |
| 26 | 8.1 | 8.24516217232305 | -0.145162172323046 |
| 27 | 8 | 7.97568953142623 | 0.0243104685737725 |
| 28 | 7.9 | 7.70242386957859 | 0.197576130421409 |
| 29 | 7.9 | 7.82410745411668 | 0.075892545883318 |
| 30 | 8 | 8.14989849277145 | -0.149898492771455 |
| 31 | 8 | 8.18379302095082 | -0.183793020950818 |
| 32 | 7.9 | 8.04547660548891 | -0.145476605488909 |
| 33 | 8 | 7.83937113366827 | 0.160628866331727 |
| 34 | 7.7 | 7.64653132369527 | 0.0534686763047275 |
| 35 | 7.2 | 7.54653132369527 | -0.346531323695273 |
| 36 | 7.5 | 8.14516217232305 | -0.645162172323045 |
| 37 | 7.3 | 8.49811340100481 | -1.19811340100481 |
| 38 | 7 | 8.321480570081 | -1.321480570081 |
| 39 | 7 | 7.89937113366827 | -0.899371133668273 |
| 40 | 7 | 7.56505075361427 | -0.565050753614273 |
| 41 | 7.2 | 7.67147065860077 | -0.471470658600773 |
| 42 | 7.3 | 7.87515226084282 | -0.575152260842818 |
| 43 | 7.1 | 7.90904678902218 | -0.809046789022182 |
| 44 | 6.8 | 7.64862093714754 | -0.848620937147545 |
| 45 | 6.4 | 7.48830650398168 | -1.08830650398168 |
| 46 | 6.1 | 7.06651150073482 | -0.966511500734817 |
| 47 | 6.5 | 6.85966574387368 | -0.359665743873681 |
| 48 | 7.7 | 7.44303291294986 | 0.256967087050138 |
| 49 | 7.9 | 7.85703885983799 | 0.0429611401620114 |
| 50 | 7.5 | 7.69566970846577 | -0.195669708465772 |
| 51 | 6.9 | 7.5025154653269 | -0.602515465326908 |
| 52 | 6.6 | 7.5192597149595 | -0.9192597149595 |
| 53 | 6.9 | 7.73252537680714 | -0.832525376807136 |
| 54 | 7.7 | 8.08884377456509 | -0.388843774565091 |
| 55 | 8 | 8.16852934139923 | -0.168529341399227 |
| 56 | 8 | 8.228640760108 | -0.228640760108001 |
| 57 | 7.7 | 8.00727160873577 | -0.307271608735773 |
| 58 | 7.3 | 7.87548651696914 | -0.575486516969137 |
| 59 | 7.4 | 7.89759595338186 | -0.497595953381864 |
| 60 | 8.1 | 8.60307255887077 | -0.503072558870774 |
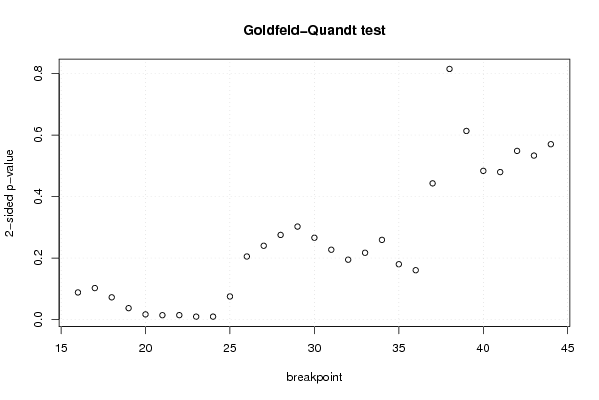
| Goldfeld-Quandt test for Heteroskedasticity | |||
| p-values | Alternative Hypothesis | ||
| breakpoint index | greater | 2-sided | less |
| 16 | 0.0441601440123017 | 0.0883202880246034 | 0.955839855987698 |
| 17 | 0.0512893989796171 | 0.102578797959234 | 0.948710601020383 |
| 18 | 0.0362467586697153 | 0.0724935173394306 | 0.963753241330285 |
| 19 | 0.0186309316381073 | 0.0372618632762146 | 0.981369068361893 |
| 20 | 0.00852684587697217 | 0.0170536917539443 | 0.991473154123028 |
| 21 | 0.0071582124452837 | 0.0143164248905674 | 0.992841787554716 |
| 22 | 0.0072333048616348 | 0.0144666097232696 | 0.992766695138365 |
| 23 | 0.00479343701728209 | 0.00958687403456418 | 0.995206562982718 |
| 24 | 0.00483508283569228 | 0.00967016567138457 | 0.995164917164308 |
| 25 | 0.0376194783186476 | 0.0752389566372952 | 0.962380521681352 |
| 26 | 0.102622640575444 | 0.205245281150887 | 0.897377359424556 |
| 27 | 0.120070094293479 | 0.240140188586958 | 0.879929905706521 |
| 28 | 0.137705397027821 | 0.275410794055643 | 0.862294602972179 |
| 29 | 0.151290465820174 | 0.302580931640348 | 0.848709534179826 |
| 30 | 0.133111577593264 | 0.266223155186529 | 0.866888422406736 |
| 31 | 0.113621767553190 | 0.227243535106380 | 0.88637823244681 |
| 32 | 0.0974169105147965 | 0.194833821029593 | 0.902583089485203 |
| 33 | 0.108678047956071 | 0.217356095912142 | 0.891321952043929 |
| 34 | 0.129651880404803 | 0.259303760809606 | 0.870348119595197 |
| 35 | 0.090058539515817 | 0.180117079031634 | 0.909941460484183 |
| 36 | 0.0803103024760515 | 0.160620604952103 | 0.919689697523949 |
| 37 | 0.221560129211651 | 0.443120258423301 | 0.77843987078835 |
| 38 | 0.592415909877044 | 0.815168180245912 | 0.407584090122956 |
| 39 | 0.693213942783929 | 0.613572114432142 | 0.306786057216071 |
| 40 | 0.758141573250394 | 0.483716853499211 | 0.241858426749606 |
| 41 | 0.760092408003112 | 0.479815183993777 | 0.239907591996888 |
| 42 | 0.725688795815237 | 0.548622408369526 | 0.274311204184763 |
| 43 | 0.733290378803413 | 0.533419242393173 | 0.266709621196587 |
| 44 | 0.714811494783157 | 0.570377010433687 | 0.285188505216843 |
| Meta Analysis of Goldfeld-Quandt test for Heteroskedasticity | |||
| Description | # significant tests | % significant tests | OK/NOK |
| 1% type I error level | 2 | 0.0689655172413793 | NOK |
| 5% type I error level | 6 | 0.206896551724138 | NOK |
| 10% type I error level | 9 | 0.310344827586207 | NOK |