| Multiple Linear Regression - Estimated Regression Equation |
| werklh[t] = + 9.65369544559226 -0.140310005125642inflatie[t] + 0.00724839024648894M1[t] -0.109041281500898M2[t] -0.379718553043269M3[t] -0.575651625508257M4[t] -0.409135097153141M5[t] -0.113843369208077M6[t] -0.0361020404429104M7[t] -0.143616512600359M8[t] -0.319906184347756M9[t] -0.559002056197666M10[t] -0.629679327740038M11[t] -0.0293227284576283t + e[t] |
| Multiple Linear Regression - Ordinary Least Squares | |||||
| Variable | Parameter | S.D. | T-STAT H0: parameter = 0 | 2-tail p-value | 1-tail p-value |
| (Intercept) | 9.65369544559226 | 0.271248 | 35.59 | 0 | 0 |
| inflatie | -0.140310005125642 | 0.039035 | -3.5945 | 0.000789 | 0.000395 |
| M1 | 0.00724839024648894 | 0.270519 | 0.0268 | 0.97874 | 0.48937 |
| M2 | -0.109041281500898 | 0.269961 | -0.4039 | 0.688147 | 0.344074 |
| M3 | -0.379718553043269 | 0.269588 | -1.4085 | 0.165703 | 0.082851 |
| M4 | -0.575651625508257 | 0.26871 | -2.1423 | 0.037497 | 0.018749 |
| M5 | -0.409135097153141 | 0.268366 | -1.5245 | 0.13422 | 0.06711 |
| M6 | -0.113843369208077 | 0.267901 | -0.4249 | 0.672857 | 0.336429 |
| M7 | -0.0361020404429104 | 0.267801 | -0.1348 | 0.893351 | 0.446676 |
| M8 | -0.143616512600359 | 0.267409 | -0.5371 | 0.59381 | 0.296905 |
| M9 | -0.319906184347756 | 0.267218 | -1.1972 | 0.237373 | 0.118686 |
| M10 | -0.559002056197666 | 0.267058 | -2.0932 | 0.041875 | 0.020938 |
| M11 | -0.629679327740038 | 0.266998 | -2.3584 | 0.022661 | 0.011331 |
| t | -0.0293227284576283 | 0.003212 | -9.1278 | 0 | 0 |
| Multiple Linear Regression - Regression Statistics | |
| Multiple R | 0.850310348823393 |
| R-squared | 0.72302768931616 |
| Adjusted R-squared | 0.644752905862031 |
| F-TEST (value) | 9.23704490016092 |
| F-TEST (DF numerator) | 13 |
| F-TEST (DF denominator) | 46 |
| p-value | 6.05654348895257e-09 |
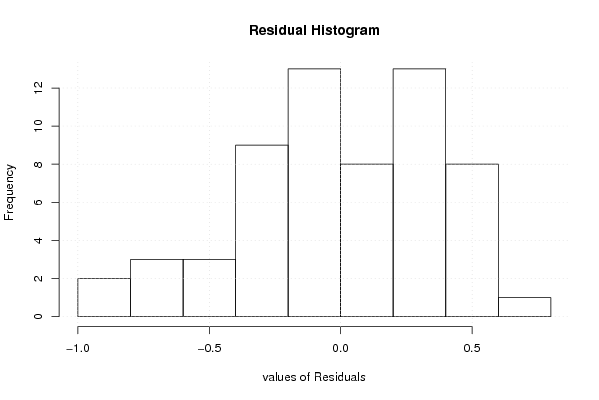
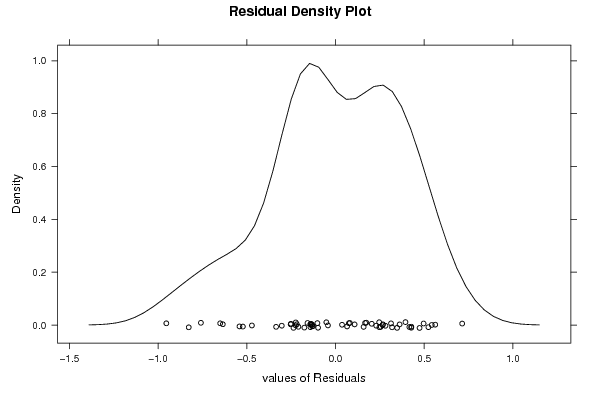
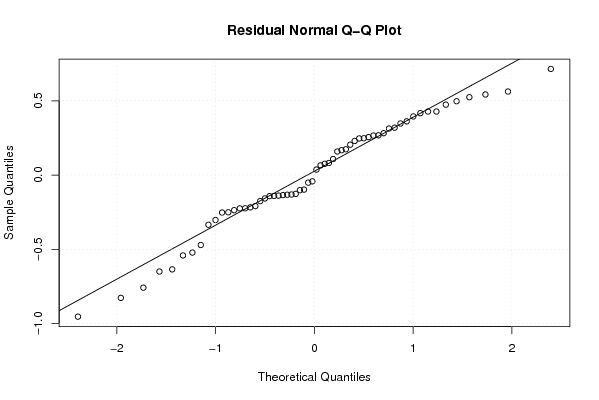
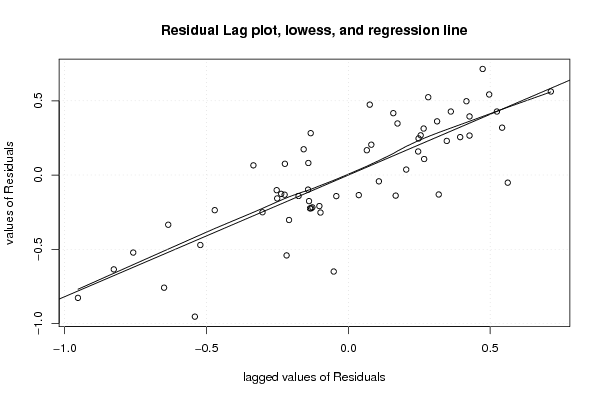
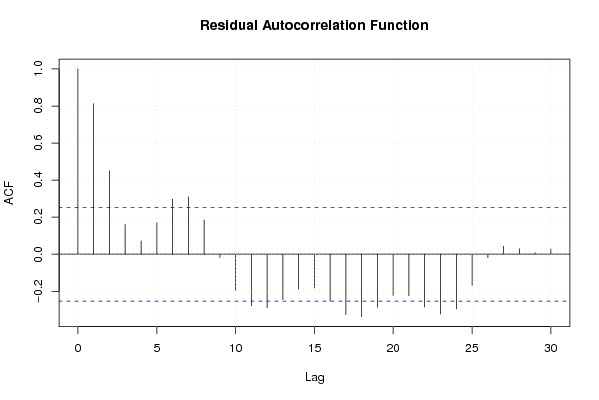
| Multiple Linear Regression - Residual Statistics | |
| Residual Standard Deviation | 0.422038240916151 |
| Sum Squared Residuals | 8.19334873259757 |
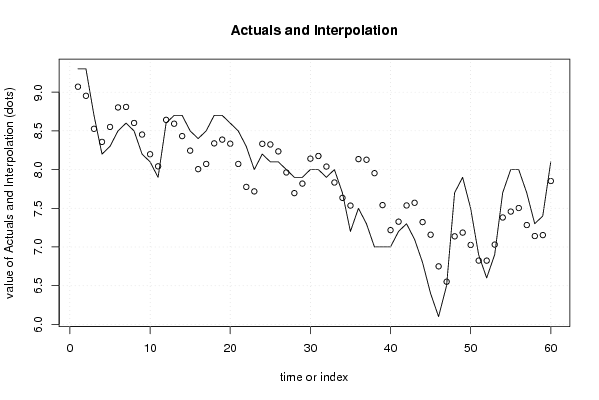
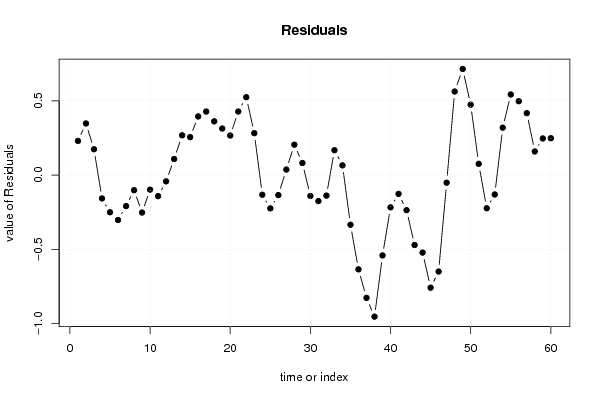
| Multiple Linear Regression - Actuals, Interpolation, and Residuals | |||
| Time or Index | Actuals | Interpolation Forecast | Residuals Prediction Error |
| 1 | 9.3 | 9.07038108687861 | 0.229618913121392 |
| 2 | 9.3 | 8.95283068769867 | 0.34716931230133 |
| 3 | 8.7 | 8.5265516830856 | 0.173448316914407 |
| 4 | 8.2 | 8.35741988421323 | -0.157419884213233 |
| 5 | 8.3 | 8.55073768616098 | -0.250737686160978 |
| 6 | 8.5 | 8.80267568513585 | -0.302675685135848 |
| 7 | 8.6 | 8.8090012839057 | -0.209001283905695 |
| 8 | 8.5 | 8.6020090807278 | -0.102009080727797 |
| 9 | 8.2 | 8.45252068257303 | -0.252520682573029 |
| 10 | 8.1 | 8.19813308277805 | -0.098133082778054 |
| 11 | 7.9 | 8.0420090807278 | -0.142009080727796 |
| 12 | 8.6 | 8.6423656800102 | -0.0423656800102068 |
| 13 | 8.7 | 8.59222934077394 | 0.107770659226060 |
| 14 | 8.7 | 8.43258594005636 | 0.267414059943641 |
| 15 | 8.5 | 8.24483394415687 | 0.255166055843126 |
| 16 | 8.4 | 8.0055471427217 | 0.394452857278307 |
| 17 | 8.5 | 8.07258594005636 | 0.42741405994364 |
| 18 | 8.7 | 8.3385549395438 | 0.361445060456203 |
| 19 | 8.7 | 8.38697353985133 | 0.313026460148665 |
| 20 | 8.6 | 8.33432234231164 | 0.265677657688357 |
| 21 | 8.5 | 8.07258594005636 | 0.42741405994364 |
| 22 | 8.3 | 7.77610533872369 | 0.523894661276307 |
| 23 | 8 | 7.71819834026139 | 0.281801659738614 |
| 24 | 8.2 | 8.33258594005636 | -0.132585940056360 |
| 25 | 8.1 | 8.32454260235778 | -0.224542602357785 |
| 26 | 8.1 | 8.23505420420303 | -0.135054204203027 |
| 27 | 8 | 7.96311620522815 | 0.0368837947718451 |
| 28 | 7.9 | 7.69576740276785 | 0.204232597232153 |
| 29 | 7.9 | 7.81893020215277 | 0.0810697978472305 |
| 30 | 8 | 8.14102320369046 | -0.141023203690462 |
| 31 | 8 | 8.17541080348544 | -0.175410803485436 |
| 32 | 7.9 | 8.03857360287036 | -0.138573602870359 |
| 33 | 8 | 7.83296120266533 | 0.167038797334666 |
| 34 | 7.7 | 7.63469760492062 | 0.0653023950793838 |
| 35 | 7.2 | 7.53469760492062 | -0.334697604920617 |
| 36 | 7.5 | 8.13505420420303 | -0.635054204203026 |
| 37 | 7.3 | 8.12701086650445 | -0.827010866504452 |
| 38 | 7 | 7.9533364652743 | -0.953336465274308 |
| 39 | 7 | 7.5410884611738 | -0.541088461173794 |
| 40 | 7 | 7.21761565666323 | -0.217615656663229 |
| 41 | 7.2 | 7.32674745553559 | -0.126747455535588 |
| 42 | 7.3 | 7.53659245297277 | -0.236592452972767 |
| 43 | 7.1 | 7.57098005276774 | -0.470980052767741 |
| 44 | 6.8 | 7.32189484805215 | -0.52189484805215 |
| 45 | 6.4 | 7.15837544938482 | -0.758375449384817 |
| 46 | 6.1 | 6.74964684395164 | -0.649646843951637 |
| 47 | 6.5 | 6.55142984036369 | -0.0514298403636871 |
| 48 | 7.7 | 7.13775543913353 | 0.562244560866467 |
| 49 | 7.9 | 7.18583610348522 | 0.714163896514785 |
| 50 | 7.5 | 7.02619270276764 | 0.473807297232364 |
| 51 | 6.9 | 6.82440970635558 | 0.0755902936444153 |
| 52 | 6.6 | 6.823649913634 | -0.223649913633997 |
| 53 | 6.9 | 7.0309987160943 | -0.130998716094305 |
| 54 | 7.7 | 7.38115371865713 | 0.318846281342874 |
| 55 | 8 | 7.45763431998979 | 0.542365680010207 |
| 56 | 8 | 7.50320012603805 | 0.496799873961950 |
| 57 | 7.7 | 7.28355672532046 | 0.416443274679540 |
| 58 | 7.3 | 7.141417129626 | 0.158582870374000 |
| 59 | 7.4 | 7.15366513372651 | 0.246334866273486 |
| 60 | 8.1 | 7.85223873659687 | 0.247761263403126 |
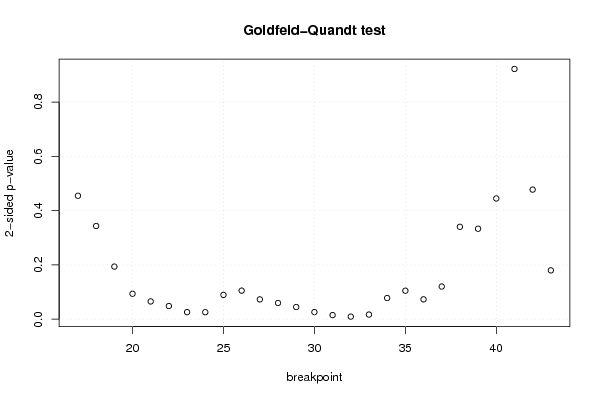
| Goldfeld-Quandt test for Heteroskedasticity | |||
| p-values | Alternative Hypothesis | ||
| breakpoint index | greater | 2-sided | less |
| 17 | 0.227403661232766 | 0.454807322465533 | 0.772596338767234 |
| 18 | 0.171675837938098 | 0.343351675876197 | 0.828324162061902 |
| 19 | 0.0968816139087476 | 0.193763227817495 | 0.903118386091252 |
| 20 | 0.0468034574599534 | 0.0936069149199068 | 0.953196542540047 |
| 21 | 0.0326774885976317 | 0.0653549771952634 | 0.967322511402368 |
| 22 | 0.0242273787053083 | 0.0484547574106167 | 0.975772621294692 |
| 23 | 0.01297844283267 | 0.02595688566534 | 0.98702155716733 |
| 24 | 0.012837667473058 | 0.025675334946116 | 0.987162332526942 |
| 25 | 0.0448065292803413 | 0.0896130585606825 | 0.955193470719659 |
| 26 | 0.0526045473330719 | 0.105209094666144 | 0.947395452666928 |
| 27 | 0.0364750320799456 | 0.0729500641598913 | 0.963524967920054 |
| 28 | 0.0298548142732299 | 0.0597096285464597 | 0.97014518572677 |
| 29 | 0.0223875836432134 | 0.0447751672864267 | 0.977612416356787 |
| 30 | 0.0130665510526925 | 0.0261331021053849 | 0.986933448947308 |
| 31 | 0.00751142563825143 | 0.0150228512765029 | 0.99248857436175 |
| 32 | 0.00465468219650521 | 0.00930936439301041 | 0.995345317803495 |
| 33 | 0.00850406109851262 | 0.0170081221970252 | 0.991495938901487 |
| 34 | 0.0389635904001886 | 0.0779271808003772 | 0.961036409599811 |
| 35 | 0.0524732894246101 | 0.104946578849220 | 0.94752671057539 |
| 36 | 0.0365919703958257 | 0.0731839407916514 | 0.963408029604174 |
| 37 | 0.0601556566217611 | 0.120311313243522 | 0.939844343378239 |
| 38 | 0.170210909274567 | 0.340421818549133 | 0.829789090725433 |
| 39 | 0.166654106593175 | 0.33330821318635 | 0.833345893406825 |
| 40 | 0.222426430962984 | 0.444852861925967 | 0.777573569037016 |
| 41 | 0.538895348910003 | 0.922209302179995 | 0.461104651089997 |
| 42 | 0.761235258845263 | 0.477529482309475 | 0.238764741154737 |
| 43 | 0.910014557553378 | 0.179970884893245 | 0.0899854424466224 |
| Meta Analysis of Goldfeld-Quandt test for Heteroskedasticity | |||
| Description | # significant tests | % significant tests | OK/NOK |
| 1% type I error level | 1 | 0.0370370370370370 | NOK |
| 5% type I error level | 8 | 0.296296296296296 | NOK |
| 10% type I error level | 15 | 0.555555555555556 | NOK |