| Multiple Linear Regression - Estimated Regression Equation |
| Y[t] = + 2.47606172468974 -0.0101296723117681X[t] + 1.60828180239800Y1[t] -1.17499297834727Y2[t] + 0.403742817331000Y3[t] -0.0323317391383595M1[t] + 0.0603188530954501M2[t] + 0.00766841204588546M3[t] -0.139875510891479M4[t] + 0.0415646067147772M5[t] -0.0899349877552565M6[t] -0.186943880017435M7[t] + 0.0422117435785372M8[t] + 0.345355463489295M9[t] -0.565778112424411M10[t] + 0.173536403281812M11[t] -0.00415623384772254t + e[t] |
| Multiple Linear Regression - Ordinary Least Squares | |||||
| Variable | Parameter | S.D. | T-STAT H0: parameter = 0 | 2-tail p-value | 1-tail p-value |
| (Intercept) | 2.47606172468974 | 0.926371 | 2.6729 | 0.010832 | 0.005416 |
| X | -0.0101296723117681 | 0.004085 | -2.4798 | 0.017457 | 0.008728 |
| Y1 | 1.60828180239800 | 0.130647 | 12.3102 | 0 | 0 |
| Y2 | -1.17499297834727 | 0.205054 | -5.7302 | 1e-06 | 1e-06 |
| Y3 | 0.403742817331000 | 0.131816 | 3.0629 | 0.00391 | 0.001955 |
| M1 | -0.0323317391383595 | 0.114051 | -0.2835 | 0.778267 | 0.389133 |
| M2 | 0.0603188530954501 | 0.130854 | 0.461 | 0.647322 | 0.323661 |
| M3 | 0.00766841204588546 | 0.135075 | 0.0568 | 0.95501 | 0.477505 |
| M4 | -0.139875510891479 | 0.130083 | -1.0753 | 0.288694 | 0.144347 |
| M5 | 0.0415646067147772 | 0.113909 | 0.3649 | 0.717113 | 0.358557 |
| M6 | -0.0899349877552565 | 0.11612 | -0.7745 | 0.443191 | 0.221595 |
| M7 | -0.186943880017435 | 0.118169 | -1.582 | 0.121525 | 0.060763 |
| M8 | 0.0422117435785372 | 0.110943 | 0.3805 | 0.705602 | 0.352801 |
| M9 | 0.345355463489295 | 0.163829 | 2.108 | 0.041342 | 0.020671 |
| M10 | -0.565778112424411 | 0.161505 | -3.5032 | 0.001147 | 0.000574 |
| M11 | 0.173536403281812 | 0.133558 | 1.2993 | 0.20127 | 0.100635 |
| t | -0.00415623384772254 | 0.002591 | -1.604 | 0.116588 | 0.058294 |
| Multiple Linear Regression - Regression Statistics | |
| Multiple R | 0.978546142626844 |
| R-squared | 0.957552553249876 |
| Adjusted R-squared | 0.940573574549827 |
| F-TEST (value) | 56.3963575292716 |
| F-TEST (DF numerator) | 16 |
| F-TEST (DF denominator) | 40 |
| p-value | 0 |
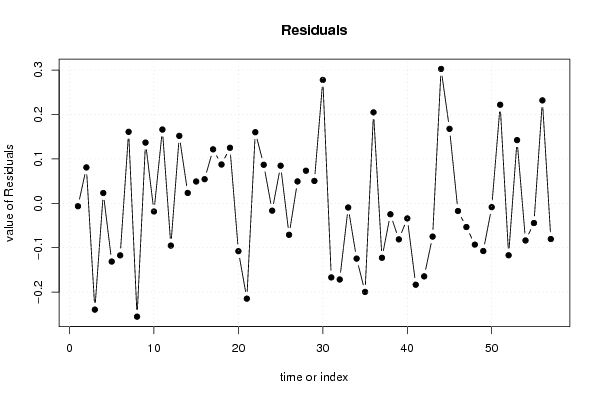
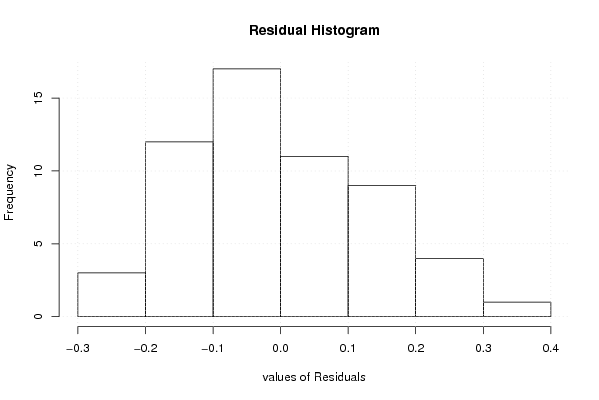
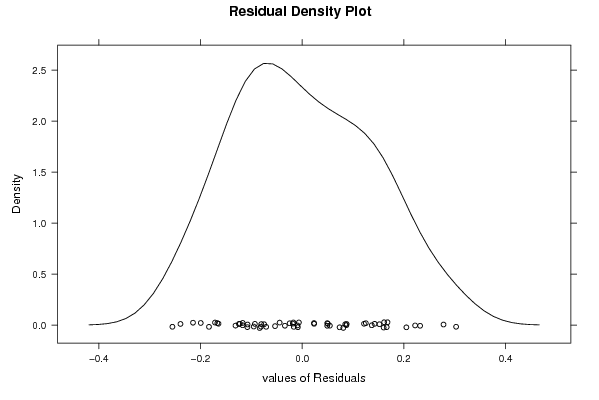
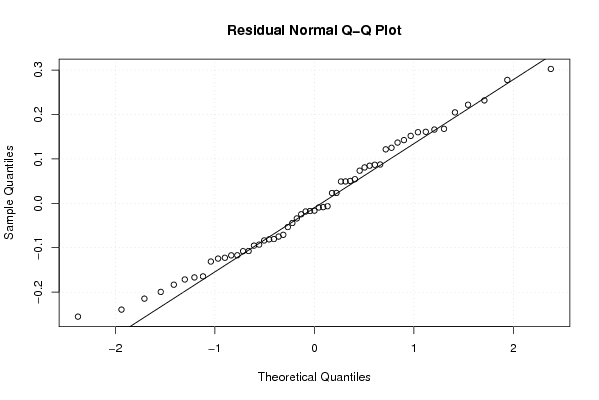
| Multiple Linear Regression - Residual Statistics | |
| Residual Standard Deviation | 0.161239934390964 |
| Sum Squared Residuals | 1.03993265769610 |
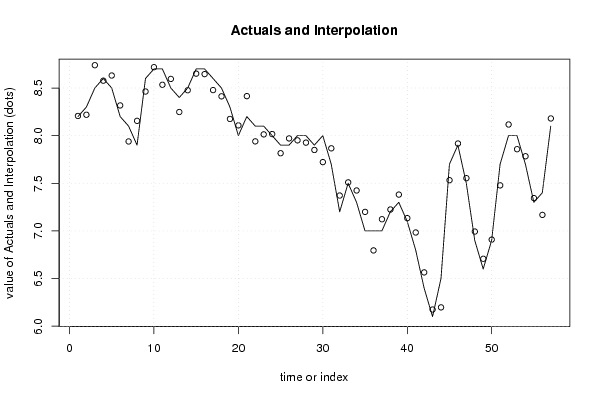
| Multiple Linear Regression - Actuals, Interpolation, and Residuals | |||
| Time or Index | Actuals | Interpolation Forecast | Residuals Prediction Error |
| 1 | 8.2 | 8.2065259819223 | -0.00652598192229426 |
| 2 | 8.3 | 8.21917347243481 | 0.080826527565189 |
| 3 | 8.5 | 8.73935348273474 | -0.239353482734742 |
| 4 | 8.6 | 8.57677040592372 | 0.0232295940762796 |
| 5 | 8.5 | 8.63111703964214 | -0.131117039642143 |
| 6 | 8.2 | 8.31712867410842 | -0.117128674108420 |
| 7 | 8.1 | 7.93896204671225 | 0.161037953287747 |
| 8 | 7.9 | 8.15520804546585 | -0.255208045465847 |
| 9 | 8.6 | 8.46319480997306 | 0.136805190026943 |
| 10 | 8.7 | 8.71840742561242 | -0.0184074256124160 |
| 11 | 8.7 | 8.53388097394549 | 0.166119026054513 |
| 12 | 8.5 | 8.59525561898883 | -0.0952556189888331 |
| 13 | 8.4 | 8.24810951755212 | 0.151890482447877 |
| 14 | 8.5 | 8.47661716139436 | 0.0233828386056436 |
| 15 | 8.7 | 8.65081731973423 | 0.0491826802657688 |
| 16 | 8.7 | 8.6456795009309 | 0.0543204990690887 |
| 17 | 8.6 | 8.47841992053892 | 0.121580079461076 |
| 18 | 8.5 | 8.41260362566173 | 0.0873963743382644 |
| 19 | 8.3 | 8.1749166318785 | 0.125083368121506 |
| 20 | 8 | 8.10777521738346 | -0.107775217383461 |
| 21 | 8.2 | 8.41468890816708 | -0.214688908167076 |
| 22 | 8.1 | 7.93984673701553 | 0.160153262984470 |
| 23 | 8.1 | 8.01320108370719 | 0.086798916292807 |
| 24 | 8 | 8.01653586494858 | -0.0165358649485785 |
| 25 | 7.9 | 7.81531225031196 | 0.0846877496880385 |
| 26 | 7.9 | 7.97089115449125 | -0.0708911544912477 |
| 27 | 8 | 7.95069080644851 | 0.0493091935514851 |
| 28 | 8 | 7.92653531878836 | 0.0734646812116348 |
| 29 | 7.9 | 7.8495693285033 | 0.0504306714966971 |
| 30 | 8 | 7.7221064400383 | 0.277893559961698 |
| 31 | 7.7 | 7.86685384060527 | -0.166853840605269 |
| 32 | 7.2 | 7.37147069880332 | -0.171470698803323 |
| 33 | 7.5 | 7.50939236500531 | -0.0093923650053092 |
| 34 | 7.3 | 7.42444357388993 | -0.124443573889929 |
| 35 | 7 | 7.19949991291147 | -0.199499912911472 |
| 36 | 7 | 6.79516042004479 | 0.204839579955214 |
| 37 | 7 | 7.12260179513377 | -0.122601795133774 |
| 38 | 7.2 | 7.22469795006708 | -0.0246979500670767 |
| 39 | 7.3 | 7.38116014191347 | -0.0811601419134722 |
| 40 | 7.1 | 7.13401725784402 | -0.034017257844018 |
| 41 | 6.8 | 6.98328306368973 | -0.183283063689729 |
| 42 | 6.4 | 6.56454302971686 | -0.164543029716863 |
| 43 | 6.1 | 6.17487782564224 | -0.0748778256422407 |
| 44 | 6.5 | 6.19738524909067 | 0.302614750909328 |
| 45 | 7.7 | 7.53226670168888 | 0.167733298311124 |
| 46 | 7.9 | 7.91730226348213 | -0.0173022634821257 |
| 47 | 7.5 | 7.55341802943585 | -0.0534180294358478 |
| 48 | 6.9 | 6.9930480960178 | -0.0930480960178024 |
| 49 | 6.6 | 6.70745045507985 | -0.107450455079847 |
| 50 | 6.9 | 6.90862026161251 | -0.00862026161250823 |
| 51 | 7.7 | 7.47797824916904 | 0.222021750830960 |
| 52 | 8 | 8.11699751651298 | -0.116997516512985 |
| 53 | 8 | 7.8576106476259 | 0.142389352374098 |
| 54 | 7.7 | 7.78361823047468 | -0.0836182304746782 |
| 55 | 7.3 | 7.34438965516174 | -0.0443896551617431 |
| 56 | 7.4 | 7.1681607892567 | 0.231839210743302 |
| 57 | 8.1 | 8.18045721516568 | -0.080457215165682 |
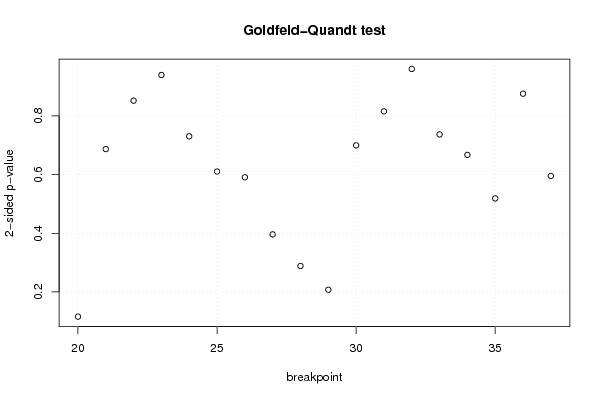
| Goldfeld-Quandt test for Heteroskedasticity | |||
| p-values | Alternative Hypothesis | ||
| breakpoint index | greater | 2-sided | less |
| 20 | 0.0579671292348971 | 0.115934258469794 | 0.942032870765103 |
| 21 | 0.656550946909541 | 0.686898106180918 | 0.343449053090459 |
| 22 | 0.5740736420742 | 0.851852715851599 | 0.425926357925799 |
| 23 | 0.469739568932071 | 0.939479137864142 | 0.530260431067929 |
| 24 | 0.365214345002387 | 0.730428690004774 | 0.634785654997613 |
| 25 | 0.305243624721757 | 0.610487249443513 | 0.694756375278243 |
| 26 | 0.295402319032801 | 0.590804638065603 | 0.704597680967199 |
| 27 | 0.19818384174624 | 0.39636768349248 | 0.80181615825376 |
| 28 | 0.144332065156976 | 0.288664130313952 | 0.855667934843024 |
| 29 | 0.103772431179154 | 0.207544862358308 | 0.896227568820846 |
| 30 | 0.349820481539287 | 0.699640963078574 | 0.650179518460713 |
| 31 | 0.407770913215974 | 0.81554182643195 | 0.592229086784026 |
| 32 | 0.479973682558649 | 0.959947365117298 | 0.520026317441351 |
| 33 | 0.36841660771305 | 0.7368332154261 | 0.63158339228695 |
| 34 | 0.333534565734883 | 0.667069131469766 | 0.666465434265117 |
| 35 | 0.259388227984045 | 0.51877645596809 | 0.740611772015955 |
| 36 | 0.562186873578296 | 0.875626252843409 | 0.437813126421704 |
| 37 | 0.702344788705741 | 0.595310422588517 | 0.297655211294259 |
| Meta Analysis of Goldfeld-Quandt test for Heteroskedasticity | |||
| Description | # significant tests | % significant tests | OK/NOK |
| 1% type I error level | 0 | 0 | OK |
| 5% type I error level | 0 | 0 | OK |
| 10% type I error level | 0 | 0 | OK |