| Multiple Linear Regression - Estimated Regression Equation |
| Y[t] = + 2.68671173294437 -0.043180403808019X[t] + 1.38949814463619Y1[t] -0.689861717000064Y2[t] -0.0431505830094493M1[t] + 0.0775144191554113M2[t] + 0.295760596745925M3[t] + 0.247109144555499M4[t] + 0.0053898005053127M5[t] + 0.0259581788623766M6[t] + 0.0267338805858564M7[t] -0.0325720489159387M8[t] + 0.0988937971289136M9[t] + 0.680602980478848M10[t] -0.247085702039494M11[t] -0.00816867183945566t + e[t] |
| Multiple Linear Regression - Ordinary Least Squares | |||||
| Variable | Parameter | S.D. | T-STAT H0: parameter = 0 | 2-tail p-value | 1-tail p-value |
| (Intercept) | 2.68671173294437 | 0.789666 | 3.4023 | 0.001478 | 0.000739 |
| X | -0.043180403808019 | 0.021873 | -1.9741 | 0.054965 | 0.027483 |
| Y1 | 1.38949814463619 | 0.118923 | 11.684 | 0 | 0 |
| Y2 | -0.689861717000064 | 0.131892 | -5.2305 | 5e-06 | 3e-06 |
| M1 | -0.0431505830094493 | 0.126666 | -0.3407 | 0.735055 | 0.367528 |
| M2 | 0.0775144191554113 | 0.13073 | 0.5929 | 0.556403 | 0.278202 |
| M3 | 0.295760596745925 | 0.131503 | 2.2491 | 0.02981 | 0.014905 |
| M4 | 0.247109144555499 | 0.133171 | 1.8556 | 0.070541 | 0.035271 |
| M5 | 0.0053898005053127 | 0.132226 | 0.0408 | 0.967679 | 0.483839 |
| M6 | 0.0259581788623766 | 0.126118 | 0.2058 | 0.837922 | 0.418961 |
| M7 | 0.0267338805858564 | 0.126659 | 0.2111 | 0.833854 | 0.416927 |
| M8 | -0.0325720489159387 | 0.128552 | -0.2534 | 0.801213 | 0.400606 |
| M9 | 0.0988937971289136 | 0.132076 | 0.7488 | 0.458171 | 0.229086 |
| M10 | 0.680602980478848 | 0.133804 | 5.0866 | 8e-06 | 4e-06 |
| M11 | -0.247085702039494 | 0.154883 | -1.5953 | 0.118141 | 0.059071 |
| t | -0.00816867183945566 | 0.002965 | -2.7547 | 0.008646 | 0.004323 |
| Multiple Linear Regression - Regression Statistics | |
| Multiple R | 0.970515489244941 |
| R-squared | 0.941900314864348 |
| Adjusted R-squared | 0.9211504273159 |
| F-TEST (value) | 45.39303225934 |
| F-TEST (DF numerator) | 15 |
| F-TEST (DF denominator) | 42 |
| p-value | 0 |
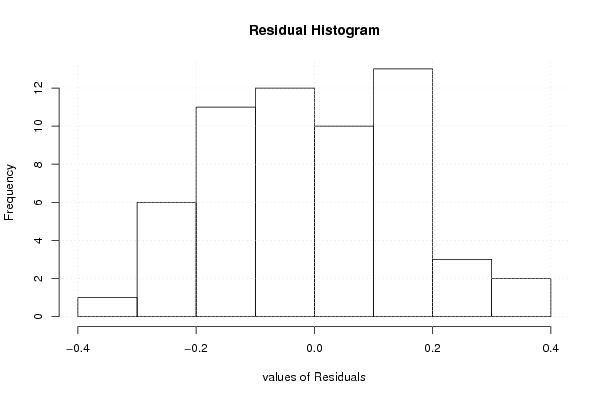
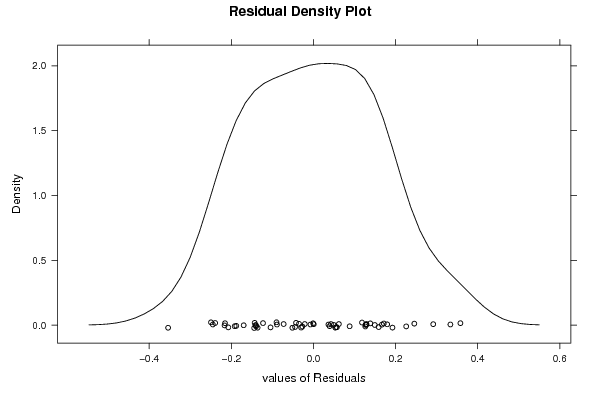
| Multiple Linear Regression - Residual Statistics | |
| Residual Standard Deviation | 0.187083644942948 |
| Sum Squared Residuals | 1.47001218861584 |
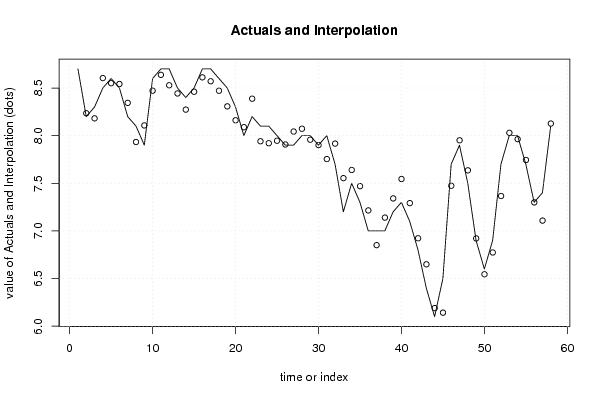
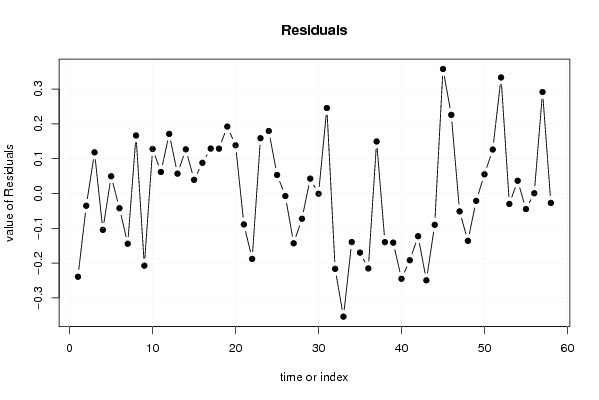
| Multiple Linear Regression - Actuals, Interpolation, and Residuals | |||
| Time or Index | Actuals | Interpolation Forecast | Residuals Prediction Error |
| 1 | 8.7 | 8.93906335721374 | -0.239063357213737 |
| 2 | 8.2 | 8.23513296228063 | -0.0351329622806318 |
| 3 | 8.3 | 8.18165058743685 | 0.118349412563156 |
| 4 | 8.5 | 8.60439309598981 | -0.104393095989810 |
| 5 | 8.6 | 8.55046441618499 | 0.0495355838150081 |
| 6 | 8.5 | 8.5422513918622 | -0.0422513918621965 |
| 7 | 8.2 | 8.3441945971058 | -0.144194597105804 |
| 8 | 8.1 | 7.9331747644545 | 0.166825235545497 |
| 9 | 7.9 | 8.1072084777731 | -0.207208477773093 |
| 10 | 8.6 | 8.47183553205634 | 0.128164467943658 |
| 11 | 8.7 | 8.63796314158228 | 0.0620368584177153 |
| 12 | 8.7 | 8.5286087439651 | 0.171391256034905 |
| 13 | 8.5 | 8.4428476404626 | 0.0571523595374015 |
| 14 | 8.4 | 8.27312630147996 | 0.126873698520035 |
| 15 | 8.5 | 8.4606361342634 | 0.0393638657365932 |
| 16 | 8.7 | 8.61175199639715 | 0.0882480036028489 |
| 17 | 8.7 | 8.57077743773474 | 0.129222562265260 |
| 18 | 8.6 | 8.47111304313715 | 0.128886956862854 |
| 19 | 8.5 | 8.30749809703434 | 0.192501902965656 |
| 20 | 8.3 | 8.16142377216788 | 0.138576227832123 |
| 21 | 8 | 8.08876161028845 | -0.0887616102884489 |
| 22 | 8.2 | 8.38774306218888 | -0.187743062188885 |
| 23 | 8.1 | 7.94106189223915 | 0.158938107760855 |
| 24 | 8.1 | 7.92032892609876 | 0.179671073901240 |
| 25 | 8 | 7.94663192371146 | 0.0533680762885351 |
| 26 | 7.9 | 7.90722431843085 | -0.00722431843084521 |
| 27 | 7.9 | 8.04302014103749 | -0.143020141037489 |
| 28 | 8 | 8.07245835023082 | -0.0724583502308218 |
| 29 | 8 | 7.957202108424 | 0.0427978915760037 |
| 30 | 7.9 | 7.9006156432416 | -0.00061564324159782 |
| 31 | 8 | 7.754272858662 | 0.245727141337996 |
| 32 | 7.7 | 7.91632444538839 | -0.216324445388387 |
| 33 | 7.2 | 7.55378600450292 | -0.353786004502921 |
| 34 | 7.5 | 7.63953595879532 | -0.139535958795324 |
| 35 | 7.3 | 7.46977694670922 | -0.169776946709217 |
| 36 | 7 | 7.21519975212039 | -0.215199752120394 |
| 37 | 7 | 6.85045907423423 | 0.149540925765770 |
| 38 | 7 | 7.13968763699404 | -0.139687636994041 |
| 39 | 7.2 | 7.3411290619835 | -0.141129061983495 |
| 40 | 7.3 | 7.54493640535765 | -0.244936405357645 |
| 41 | 7.1 | 7.2917078201508 | -0.191707820150807 |
| 42 | 6.8 | 6.92267740299476 | -0.122677402994755 |
| 43 | 6.4 | 6.64936145403034 | -0.249361454030341 |
| 44 | 6.1 | 6.18986570612662 | -0.089865706126616 |
| 45 | 6.5 | 6.14203184107557 | 0.357968158924434 |
| 46 | 7.7 | 7.47401208515974 | 0.225987914840261 |
| 47 | 7.9 | 7.95119801946935 | -0.0511980194693528 |
| 48 | 7.5 | 7.63586257781575 | -0.135862577815750 |
| 49 | 6.9 | 6.92099800437797 | -0.020998004377969 |
| 50 | 6.6 | 6.54482878081452 | 0.0551712191854826 |
| 51 | 6.9 | 6.77356407527876 | 0.126435924721236 |
| 52 | 7.7 | 7.36646015202457 | 0.333539847975428 |
| 53 | 8 | 8.02984821750547 | -0.029848217505466 |
| 54 | 8 | 7.9633425187643 | 0.0366574812356958 |
| 55 | 7.7 | 7.74467299316751 | -0.0446729931675073 |
| 56 | 7.3 | 7.29921131186262 | 0.000788688137382976 |
| 57 | 7.4 | 7.10821206635997 | 0.291787933640029 |
| 58 | 8.1 | 8.1268733617997 | -0.0268733617997096 |
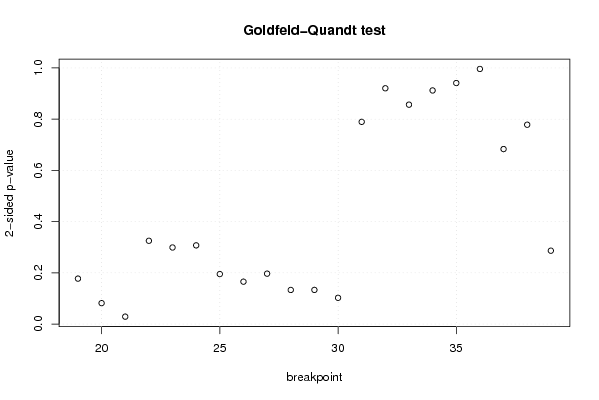
| Goldfeld-Quandt test for Heteroskedasticity | |||
| p-values | Alternative Hypothesis | ||
| breakpoint index | greater | 2-sided | less |
| 19 | 0.0888060427452122 | 0.177612085490424 | 0.911193957254788 |
| 20 | 0.040926573768289 | 0.081853147536578 | 0.95907342623171 |
| 21 | 0.0145564551364843 | 0.0291129102729687 | 0.985443544863516 |
| 22 | 0.162650393256764 | 0.325300786513528 | 0.837349606743236 |
| 23 | 0.149559533585754 | 0.299119067171509 | 0.850440466414246 |
| 24 | 0.153691965223955 | 0.307383930447909 | 0.846308034776045 |
| 25 | 0.0976615996551004 | 0.195323199310201 | 0.9023384003449 |
| 26 | 0.0828125354159154 | 0.165625070831831 | 0.917187464584085 |
| 27 | 0.0984591412626508 | 0.196918282525302 | 0.90154085873735 |
| 28 | 0.0666679415888569 | 0.133335883177714 | 0.933332058411143 |
| 29 | 0.0667591820561859 | 0.133518364112372 | 0.933240817943814 |
| 30 | 0.0512846865260479 | 0.102569373052096 | 0.948715313473952 |
| 31 | 0.394757513133859 | 0.789515026267718 | 0.605242486866141 |
| 32 | 0.460272249851489 | 0.920544499702979 | 0.539727750148511 |
| 33 | 0.428294490750938 | 0.856588981501875 | 0.571705509249062 |
| 34 | 0.456058087196586 | 0.912116174393173 | 0.543941912803414 |
| 35 | 0.470494852073462 | 0.940989704146923 | 0.529505147926538 |
| 36 | 0.501988036124708 | 0.996023927750583 | 0.498011963875292 |
| 37 | 0.658350751464863 | 0.683298497070274 | 0.341649248535137 |
| 38 | 0.610874389521101 | 0.778251220957798 | 0.389125610478899 |
| 39 | 0.85670120746094 | 0.286597585078121 | 0.143298792539060 |
| Meta Analysis of Goldfeld-Quandt test for Heteroskedasticity | |||
| Description | # significant tests | % significant tests | OK/NOK |
| 1% type I error level | 0 | 0 | OK |
| 5% type I error level | 1 | 0.0476190476190476 | OK |
| 10% type I error level | 2 | 0.0952380952380952 | OK |