| Multiple Linear Regression - Estimated Regression Equation |
| Y[t] = + 3.62399518778054 -0.0116550205248898X[t] + 1.33908375456985Y1[t] -0.61955467605507Y2[t] -0.0436568455591268M1[t] + 0.00299857923202550M2[t] + 0.143563257409505M3[t] + 0.122170287553879M4[t] -0.103225295505422M5[t] + 0.00667643070592493M6[t] -0.072453772067619M7[t] -0.138084807294505M8[t] + 0.101050909401817M9[t] + 0.405496234642471M10[t] -0.370533810105535M11[t] -0.00742558647969111t + e[t] |
| Multiple Linear Regression - Ordinary Least Squares | |||||
| Variable | Parameter | S.D. | T-STAT H0: parameter = 0 | 2-tail p-value | 1-tail p-value |
| (Intercept) | 3.62399518778054 | 0.961784 | 3.768 | 0.000507 | 0.000254 |
| X | -0.0116550205248898 | 0.004553 | -2.5601 | 0.014151 | 0.007075 |
| Y1 | 1.33908375456985 | 0.117256 | 11.4202 | 0 | 0 |
| Y2 | -0.61955467605507 | 0.119921 | -5.1663 | 6e-06 | 3e-06 |
| M1 | -0.0436568455591268 | 0.123152 | -0.3545 | 0.724742 | 0.362371 |
| M2 | 0.00299857923202550 | 0.131882 | 0.0227 | 0.981968 | 0.490984 |
| M3 | 0.143563257409505 | 0.147543 | 0.973 | 0.33611 | 0.168055 |
| M4 | 0.122170287553879 | 0.14572 | 0.8384 | 0.406558 | 0.203279 |
| M5 | -0.103225295505422 | 0.140214 | -0.7362 | 0.465703 | 0.232852 |
| M6 | 0.00667643070592493 | 0.123197 | 0.0542 | 0.957038 | 0.478519 |
| M7 | -0.072453772067619 | 0.130933 | -0.5534 | 0.582946 | 0.291473 |
| M8 | -0.138084807294505 | 0.134657 | -1.0255 | 0.311019 | 0.15551 |
| M9 | 0.101050909401817 | 0.127655 | 0.7916 | 0.433044 | 0.216522 |
| M10 | 0.405496234642471 | 0.184213 | 2.2012 | 0.033267 | 0.016634 |
| M11 | -0.370533810105535 | 0.164088 | -2.2581 | 0.029192 | 0.014596 |
| t | -0.00742558647969111 | 0.00262 | -2.8342 | 0.007032 | 0.003516 |
| Multiple Linear Regression - Regression Statistics | |
| Multiple R | 0.972152036416714 |
| R-squared | 0.945079581909165 |
| Adjusted R-squared | 0.925465146876724 |
| F-TEST (value) | 48.1828602427782 |
| F-TEST (DF numerator) | 15 |
| F-TEST (DF denominator) | 42 |
| p-value | 0 |
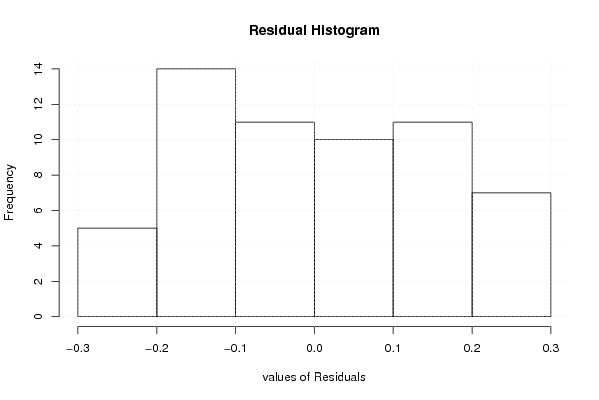
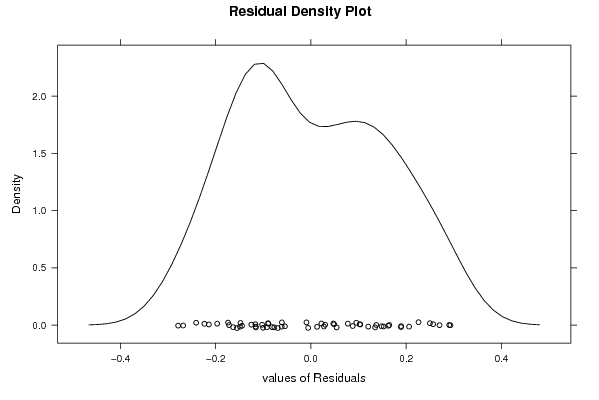
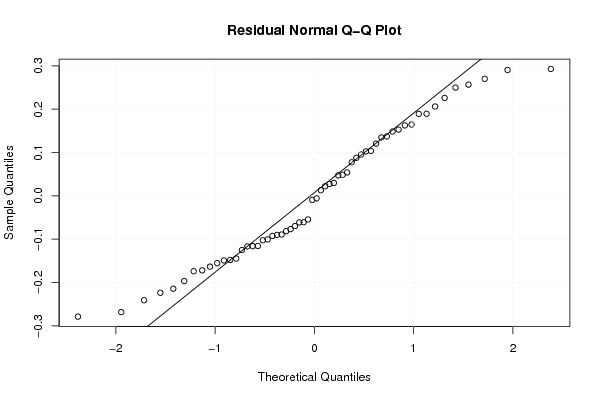
| Multiple Linear Regression - Residual Statistics | |
| Residual Standard Deviation | 0.181892943332620 |
| Sum Squared Residuals | 1.38957179903655 |
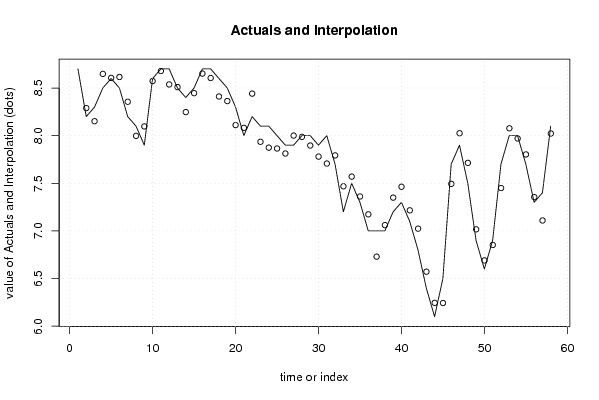
| Multiple Linear Regression - Actuals, Interpolation, and Residuals | |||
| Time or Index | Actuals | Interpolation Forecast | Residuals Prediction Error |
| 1 | 8.7 | 8.97898442203381 | -0.278984422033815 |
| 2 | 8.2 | 8.28935613896266 | -0.0893561389626577 |
| 3 | 8.3 | 8.15149270621581 | 0.148507293784190 |
| 4 | 8.5 | 8.64794500703924 | -0.147945007039241 |
| 5 | 8.6 | 8.60583359412635 | -0.00583359412635362 |
| 6 | 8.5 | 8.61574299348495 | -0.115742993484950 |
| 7 | 8.2 | 8.35546790016651 | -0.155467900166515 |
| 8 | 8.1 | 7.99742021616147 | 0.102579783838529 |
| 9 | 7.9 | 8.09693904944438 | -0.196939049444379 |
| 10 | 8.6 | 8.57271318221824 | 0.0272868177817554 |
| 11 | 8.7 | 8.67803281063208 | 0.021967189367915 |
| 12 | 8.7 | 8.5373982772908 | 0.162601722709207 |
| 13 | 8.5 | 8.50944202747816 | -0.00944202747816331 |
| 14 | 8.4 | 8.24705555535347 | 0.152944444646525 |
| 15 | 8.5 | 8.44595484021708 | 0.0540451597829233 |
| 16 | 8.7 | 8.65146169467639 | 0.0485383053236123 |
| 17 | 8.7 | 8.60468827355354 | 0.0953117264464555 |
| 18 | 8.6 | 8.41075917430582 | 0.189240825694183 |
| 19 | 8.5 | 8.36278931336397 | 0.137210686636033 |
| 20 | 8.3 | 8.11055359497693 | 0.189446405023075 |
| 21 | 8 | 8.08162384541811 | -0.0816238454181131 |
| 22 | 8.2 | 8.44115599234592 | -0.241155992345917 |
| 23 | 8.1 | 7.93539270492287 | 0.164607295077126 |
| 24 | 8.1 | 7.8740148243748 | 0.225985175625205 |
| 25 | 8 | 7.86507432504917 | 0.134925674950829 |
| 26 | 7.9 | 7.81235386179325 | 0.0876461382067493 |
| 27 | 7.9 | 8.00057976936086 | -0.100579769360861 |
| 28 | 8 | 7.9870965985315 | 0.0129034014685088 |
| 29 | 8 | 7.8963423188169 | 0.103657681183094 |
| 30 | 7.9 | 7.77952021385704 | 0.120479786142958 |
| 31 | 8 | 7.70707480981292 | 0.292925190187076 |
| 32 | 7.7 | 7.79258596548919 | -0.0925859654891908 |
| 33 | 7.2 | 7.46854083958273 | -0.268540839582731 |
| 34 | 7.5 | 7.56976411084007 | -0.0697641108400692 |
| 35 | 7.3 | 7.36144720386965 | -0.0614472038696505 |
| 36 | 7 | 7.17413560340842 | -0.174135603408418 |
| 37 | 7 | 6.72985427701325 | 0.270145722986750 |
| 38 | 7 | 7.06101120491773 | -0.0610112049177301 |
| 39 | 7.2 | 7.34916206959655 | -0.149162069596553 |
| 40 | 7.3 | 7.46345154455888 | -0.163451544558885 |
| 41 | 7.1 | 7.21615227216359 | -0.116152272163594 |
| 42 | 6.8 | 7.02382125495044 | -0.223821254950443 |
| 43 | 6.4 | 6.5720386206006 | -0.172038620600593 |
| 44 | 6.1 | 6.2447860681867 | -0.144786068186696 |
| 45 | 6.5 | 6.24333880288515 | 0.256661197114851 |
| 46 | 7.7 | 7.49379335473588 | 0.206206645264122 |
| 47 | 7.9 | 8.0251272805754 | -0.125127280575391 |
| 48 | 7.5 | 7.714451294926 | -0.214451294925994 |
| 49 | 6.9 | 7.0166449484256 | -0.116644948425601 |
| 50 | 6.6 | 6.69022323897289 | -0.0902232389728868 |
| 51 | 6.9 | 6.8528106146097 | 0.0471893853903009 |
| 52 | 7.7 | 7.450045155194 | 0.249954844806005 |
| 53 | 8 | 8.0769835413396 | -0.0769835413396017 |
| 54 | 8 | 7.97015636340175 | 0.0298436365982526 |
| 55 | 7.7 | 7.802629356056 | -0.102629356056000 |
| 56 | 7.3 | 7.35465415518572 | -0.0546541551857161 |
| 57 | 7.4 | 7.10955746266963 | 0.290442537330372 |
| 58 | 8.1 | 8.02257335985989 | 0.0774266401401095 |
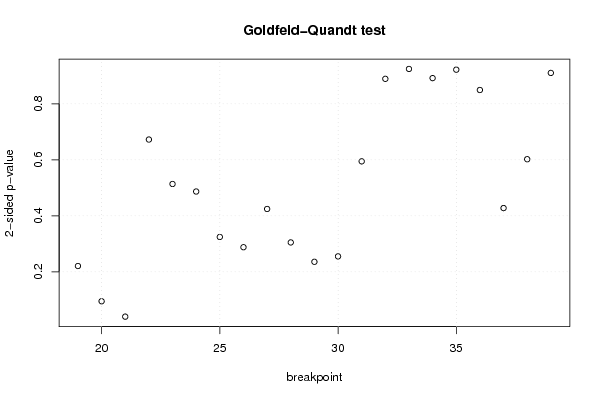
| Goldfeld-Quandt test for Heteroskedasticity | |||
| p-values | Alternative Hypothesis | ||
| breakpoint index | greater | 2-sided | less |
| 19 | 0.110386684021665 | 0.22077336804333 | 0.889613315978335 |
| 20 | 0.0474235347152211 | 0.0948470694304422 | 0.95257646528478 |
| 21 | 0.0199295154048947 | 0.0398590308097894 | 0.980070484595105 |
| 22 | 0.33626285068218 | 0.67252570136436 | 0.66373714931782 |
| 23 | 0.256893983121180 | 0.513787966242359 | 0.743106016878820 |
| 24 | 0.243423559801891 | 0.486847119603783 | 0.756576440198109 |
| 25 | 0.162235360667181 | 0.324470721334361 | 0.83776463933282 |
| 26 | 0.143944282298391 | 0.287888564596782 | 0.856055717701609 |
| 27 | 0.212250147057955 | 0.424500294115910 | 0.787749852942045 |
| 28 | 0.152482212898269 | 0.304964425796539 | 0.84751778710173 |
| 29 | 0.117896606932236 | 0.235793213864473 | 0.882103393067764 |
| 30 | 0.127600706191216 | 0.255201412382432 | 0.872399293808784 |
| 31 | 0.297335119147114 | 0.594670238294229 | 0.702664880852885 |
| 32 | 0.444727132441478 | 0.889454264882957 | 0.555272867558521 |
| 33 | 0.537645440291964 | 0.924709119416072 | 0.462354559708036 |
| 34 | 0.445976725922443 | 0.891953451844886 | 0.554023274077557 |
| 35 | 0.461052492918866 | 0.922104985837733 | 0.538947507081134 |
| 36 | 0.424755292263422 | 0.849510584526844 | 0.575244707736578 |
| 37 | 0.786116215129241 | 0.427767569741517 | 0.213883784870759 |
| 38 | 0.698885028455685 | 0.602229943088629 | 0.301114971544315 |
| 39 | 0.54475091640926 | 0.91049816718148 | 0.45524908359074 |
| Meta Analysis of Goldfeld-Quandt test for Heteroskedasticity | |||
| Description | # significant tests | % significant tests | OK/NOK |
| 1% type I error level | 0 | 0 | OK |
| 5% type I error level | 1 | 0.0476190476190476 | OK |
| 10% type I error level | 2 | 0.0952380952380952 | OK |