| Multiple Linear Regression - Estimated Regression Equation |
| Omzet[t] = + 29.6444465901532 + 0.832814320948403Productie[t] -13.2023060390343M1[t] -14.0192330461690M2[t] -7.22885821757064M3[t] -12.0853823690019M4[t] -11.0120699935285M5[t] -8.77747562585243M6[t] -10.5632622060097M7[t] -20.7979652292691M8[t] -14.2683565650436M9[t] -10.2440374584020M10[t] -8.42173846251315M11[t] + 0.697992924868762t + e[t] |
| Multiple Linear Regression - Ordinary Least Squares | |||||
| Variable | Parameter | S.D. | T-STAT H0: parameter = 0 | 2-tail p-value | 1-tail p-value |
| (Intercept) | 29.6444465901532 | 14.96341 | 1.9811 | 0.052585 | 0.026293 |
| Productie | 0.832814320948403 | 0.157747 | 5.2794 | 2e-06 | 1e-06 |
| M1 | -13.2023060390343 | 2.641013 | -4.999 | 6e-06 | 3e-06 |
| M2 | -14.0192330461690 | 2.649091 | -5.2921 | 2e-06 | 1e-06 |
| M3 | -7.22885821757064 | 3.168455 | -2.2815 | 0.026412 | 0.013206 |
| M4 | -12.0853823690019 | 2.761009 | -4.3772 | 5.4e-05 | 2.7e-05 |
| M5 | -11.0120699935285 | 2.684727 | -4.1017 | 0.000137 | 6.8e-05 |
| M6 | -8.77747562585243 | 3.277109 | -2.6784 | 0.009735 | 0.004868 |
| M7 | -10.5632622060097 | 3.288779 | -3.2119 | 0.002205 | 0.001102 |
| M8 | -20.7979652292691 | 2.680361 | -7.7594 | 0 | 0 |
| M9 | -14.2683565650436 | 3.283533 | -4.3454 | 6e-05 | 3e-05 |
| M10 | -10.2440374584020 | 3.448381 | -2.9707 | 0.004399 | 0.002199 |
| M11 | -8.42173846251315 | 2.972414 | -2.8333 | 0.006428 | 0.003214 |
| t | 0.697992924868762 | 0.039542 | 17.6521 | 0 | 0 |
| Multiple Linear Regression - Regression Statistics | |
| Multiple R | 0.979694556876288 |
| R-squared | 0.959801424773025 |
| Adjusted R-squared | 0.95029994335574 |
| F-TEST (value) | 101.015976627284 |
| F-TEST (DF numerator) | 13 |
| F-TEST (DF denominator) | 55 |
| p-value | 0 |
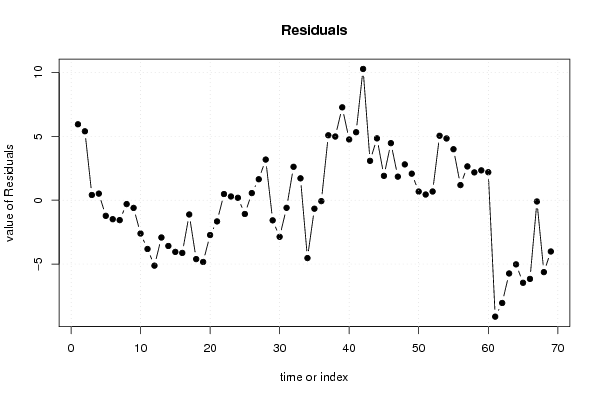
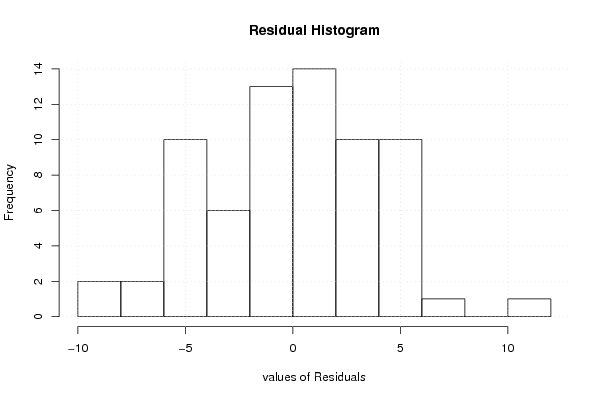
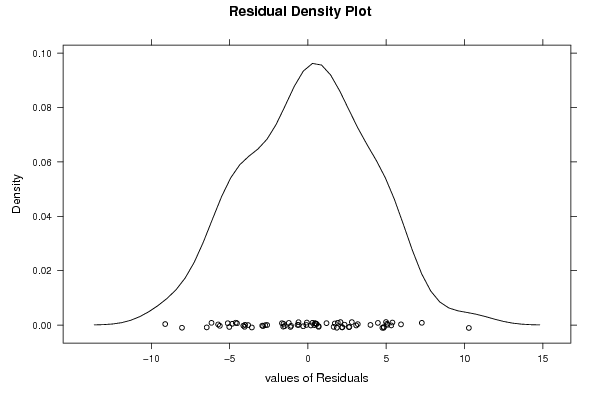
| Multiple Linear Regression - Residual Statistics | |
| Residual Standard Deviation | 4.35053862743482 |
| Sum Squared Residuals | 1040.99524918413 |
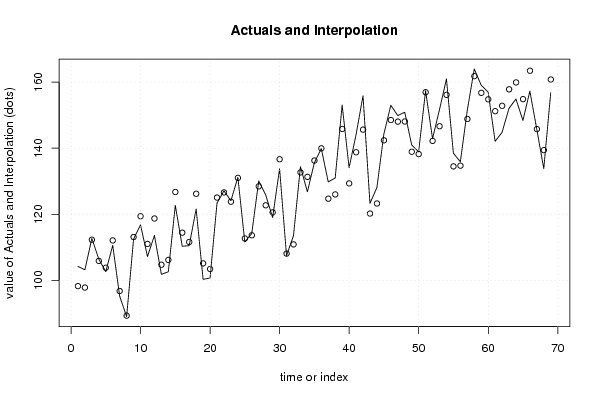
| Multiple Linear Regression - Actuals, Interpolation, and Residuals | |||
| Time or Index | Actuals | Interpolation Forecast | Residuals Prediction Error |
| 1 | 104.2 | 98.256248336362 | 5.94375166363801 |
| 2 | 103.2 | 97.8041885257167 | 5.39581147428328 |
| 3 | 112.7 | 112.288196575150 | 0.411803424849511 |
| 4 | 106.4 | 105.881066682027 | 0.518933317972653 |
| 5 | 102.6 | 103.821426106007 | -1.22142610600683 |
| 6 | 110.6 | 112.084025052621 | -1.48402505262144 |
| 7 | 95.2 | 96.7551065091152 | -1.5551065091152 |
| 8 | 89 | 89.3004322130956 | -0.300432213095634 |
| 9 | 112.5 | 113.101038789063 | -0.601038789063119 |
| 10 | 116.8 | 119.405698030375 | -2.60569803037536 |
| 11 | 107.2 | 111.016122346709 | -3.8161223467089 |
| 12 | 113.6 | 118.720069388479 | -5.12006938847858 |
| 13 | 101.8 | 104.716690496606 | -2.91669049660587 |
| 14 | 102.6 | 106.180103624142 | -3.58010362414194 |
| 15 | 122.7 | 126.743656216499 | -4.04365621649898 |
| 16 | 110.3 | 114.423544644642 | -4.12354464464214 |
| 17 | 110.5 | 111.614371179768 | -1.11437117976810 |
| 18 | 121.6 | 126.206358965591 | -4.60635896559055 |
| 19 | 100.3 | 105.131021607540 | -4.83102160754035 |
| 20 | 100.7 | 103.422766126065 | -2.72276612606474 |
| 21 | 123.4 | 125.058055467566 | -1.65805546756638 |
| 22 | 127.1 | 126.615673079473 | 0.484326920527255 |
| 23 | 124.1 | 123.805953346161 | 0.294046653839383 |
| 24 | 131.2 | 131.010211795361 | 0.189788204638797 |
| 25 | 111.6 | 112.676198434557 | -1.0761984345568 |
| 26 | 114.2 | 113.639922969524 | 0.560077030476217 |
| 27 | 130.1 | 128.457056747337 | 1.64294325266311 |
| 28 | 125.9 | 122.716178310972 | 3.18382168902757 |
| 29 | 119 | 120.573256302857 | -1.57325630285711 |
| 30 | 133.8 | 136.664309866387 | -2.86430986638669 |
| 31 | 107.5 | 108.093643619801 | -0.593643619800858 |
| 32 | 113.5 | 110.882585471447 | 2.61741452855336 |
| 33 | 134.4 | 132.684437677138 | 1.71556232286203 |
| 34 | 126.8 | 131.327205165725 | -4.52720516572491 |
| 35 | 135.6 | 136.262658617233 | -0.662658617232932 |
| 36 | 139.9 | 139.969096918450 | -0.0690969184502082 |
| 37 | 129.8 | 124.716496545155 | 5.08350345484509 |
| 38 | 131 | 126.013346808501 | 4.98665319149873 |
| 39 | 153.1 | 145.827366512005 | 7.2726334879952 |
| 40 | 134.1 | 129.343183335406 | 4.75681666459406 |
| 41 | 144.1 | 138.776380388473 | 5.32361961152656 |
| 42 | 155.9 | 145.623194989476 | 10.2768050105243 |
| 43 | 123.3 | 120.217223162494 | 3.0827768375062 |
| 44 | 128.1 | 123.256009310424 | 4.84399068957587 |
| 45 | 144.3 | 142.392855689081 | 1.90714431091945 |
| 46 | 153 | 148.530952066203 | 4.46904793379688 |
| 47 | 149.9 | 148.053112431547 | 1.84688756845348 |
| 48 | 150.9 | 148.095167720591 | 2.80483227940916 |
| 49 | 141 | 138.922111890219 | 2.07788810978111 |
| 50 | 138.9 | 138.220207783289 | 0.679792216710943 |
| 51 | 157.4 | 156.951568869560 | 0.448431130440338 |
| 52 | 142.9 | 142.216295766952 | 0.683704233047565 |
| 53 | 151.7 | 146.652606894330 | 5.04739310567046 |
| 54 | 161 | 156.164427322367 | 4.83557267763329 |
| 55 | 138.5 | 134.506119939653 | 3.99388006034739 |
| 56 | 135.9 | 134.713337396358 | 1.18666260364164 |
| 57 | 151.5 | 148.853297849324 | 2.64670215067564 |
| 58 | 164 | 161.820471658224 | 2.17952834177614 |
| 59 | 159.1 | 156.762153258351 | 2.33784674164897 |
| 60 | 157 | 154.805454177119 | 2.19454582288084 |
| 61 | 142.1 | 151.212254297102 | -9.11225429710153 |
| 62 | 144.8 | 152.842230288827 | -8.04223028882722 |
| 63 | 152.1 | 157.832155079449 | -5.73215507944917 |
| 64 | 154.9 | 159.919731260000 | -5.01973125999971 |
| 65 | 148.4 | 154.861959128565 | -6.46195912856498 |
| 66 | 157.3 | 163.457683803559 | -6.15768380355891 |
| 67 | 145.7 | 145.796885161397 | -0.0968851613971864 |
| 68 | 133.8 | 139.424869482611 | -5.6248694826105 |
| 69 | 156.8 | 160.810314527828 | -4.01031452782762 |
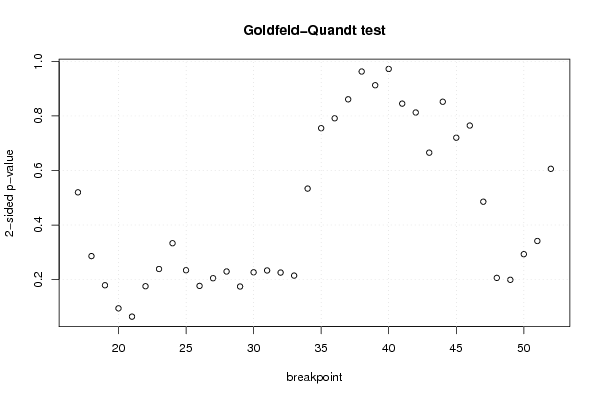
| Goldfeld-Quandt test for Heteroskedasticity | |||
| p-values | Alternative Hypothesis | ||
| breakpoint index | greater | 2-sided | less |
| 17 | 0.259945051993976 | 0.519890103987952 | 0.740054948006024 |
| 18 | 0.143106340057154 | 0.286212680114308 | 0.856893659942846 |
| 19 | 0.08970239208989 | 0.17940478417978 | 0.91029760791011 |
| 20 | 0.0474590012790256 | 0.0949180025580512 | 0.952540998720974 |
| 21 | 0.0321730768510723 | 0.0643461537021446 | 0.967826923148928 |
| 22 | 0.087889503365567 | 0.175779006731134 | 0.912110496634433 |
| 23 | 0.119454256318114 | 0.238908512636227 | 0.880545743681886 |
| 24 | 0.166685892396935 | 0.333371784793871 | 0.833314107603065 |
| 25 | 0.117224748326337 | 0.234449496652674 | 0.882775251673663 |
| 26 | 0.0885162024594634 | 0.177032404918927 | 0.911483797540537 |
| 27 | 0.102605703861198 | 0.205211407722396 | 0.897394296138802 |
| 28 | 0.114937948974310 | 0.229875897948621 | 0.88506205102569 |
| 29 | 0.0873774004344976 | 0.174754800868995 | 0.912622599565502 |
| 30 | 0.113423158115165 | 0.226846316230330 | 0.886576841884835 |
| 31 | 0.116819857577433 | 0.233639715154867 | 0.883180142422567 |
| 32 | 0.112933024658486 | 0.225866049316972 | 0.887066975341514 |
| 33 | 0.107362192002191 | 0.214724384004382 | 0.89263780799781 |
| 34 | 0.266792899036205 | 0.53358579807241 | 0.733207100963795 |
| 35 | 0.377435545936608 | 0.754871091873216 | 0.622564454063392 |
| 36 | 0.604421526369547 | 0.791156947260906 | 0.395578473630453 |
| 37 | 0.569622662565253 | 0.860754674869495 | 0.430377337434748 |
| 38 | 0.518732960497468 | 0.962534079005063 | 0.481267039502532 |
| 39 | 0.543851462876067 | 0.912297074247866 | 0.456148537123933 |
| 40 | 0.485999150434547 | 0.971998300869093 | 0.514000849565453 |
| 41 | 0.422467289444829 | 0.844934578889658 | 0.577532710555171 |
| 42 | 0.593815496428087 | 0.812369007143826 | 0.406184503571913 |
| 43 | 0.667379860996874 | 0.665240278006252 | 0.332620139003126 |
| 44 | 0.574079177232747 | 0.851841645534507 | 0.425920822767253 |
| 45 | 0.639966496273185 | 0.72006700745363 | 0.360033503726815 |
| 46 | 0.617702650600037 | 0.764594698799926 | 0.382297349399963 |
| 47 | 0.757239919331551 | 0.485520161336897 | 0.242760080668449 |
| 48 | 0.896769080255322 | 0.206461839489357 | 0.103230919744678 |
| 49 | 0.900320233543296 | 0.199359532913408 | 0.099679766456704 |
| 50 | 0.853382271653906 | 0.293235456692188 | 0.146617728346094 |
| 51 | 0.829217059141855 | 0.34156588171629 | 0.170782940858145 |
| 52 | 0.696986177116865 | 0.60602764576627 | 0.303013822883135 |
| Meta Analysis of Goldfeld-Quandt test for Heteroskedasticity | |||
| Description | # significant tests | % significant tests | OK/NOK |
| 1% type I error level | 0 | 0 | OK |
| 5% type I error level | 0 | 0 | OK |
| 10% type I error level | 2 | 0.0555555555555556 | OK |