| Multiple Linear Regression - Estimated Regression Equation |
| WHL[t] = + 537.42712288551 + 1.13414112306967ICONS[t] + e[t] |
| Multiple Linear Regression - Ordinary Least Squares | |||||
| Variable | Parameter | S.D. | T-STAT H0: parameter = 0 | 2-tail p-value | 1-tail p-value |
| (Intercept) | 537.42712288551 | 13.960787 | 38.4955 | 0 | 0 |
| ICONS | 1.13414112306967 | 0.745013 | 1.5223 | 0.133365 | 0.066682 |
| Multiple Linear Regression - Regression Statistics | |
| Multiple R | 0.196011750165139 |
| R-squared | 0.0384206062028008 |
| Adjusted R-squared | 0.0218416511373318 |
| F-TEST (value) | 2.31743231410429 |
| F-TEST (DF numerator) | 1 |
| F-TEST (DF denominator) | 58 |
| p-value | 0.133364918003988 |
| Multiple Linear Regression - Residual Statistics | |
| Residual Standard Deviation | 41.3262635143747 |
| Sum Squared Residuals | 99055.883251453 |
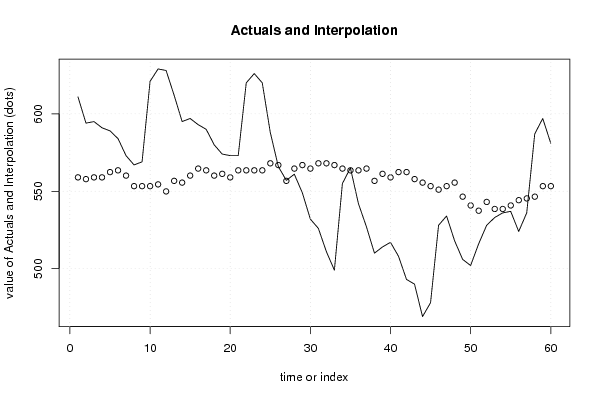
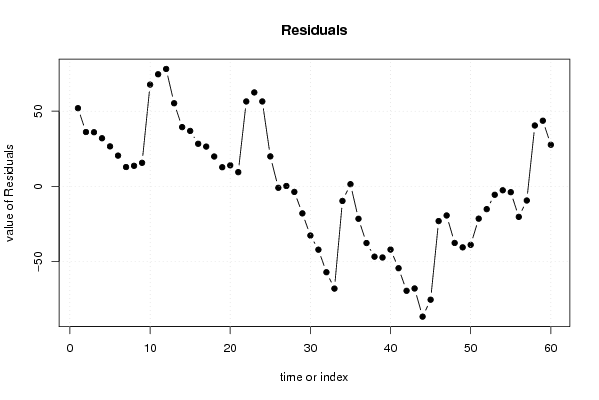
| Multiple Linear Regression - Actuals, Interpolation, and Residuals | |||
| Time or Index | Actuals | Interpolation Forecast | Residuals Prediction Error |
| 1 | 611 | 558.975804223834 | 52.0241957761664 |
| 2 | 594 | 557.841663100764 | 36.1583368992357 |
| 3 | 595 | 558.975804223834 | 36.0241957761660 |
| 4 | 591 | 558.975804223834 | 32.0241957761660 |
| 5 | 589 | 562.378227593043 | 26.621772406957 |
| 6 | 584 | 563.512368716113 | 20.4876312838873 |
| 7 | 573 | 560.109945346904 | 12.8900546530964 |
| 8 | 567 | 553.305098608486 | 13.6949013915144 |
| 9 | 569 | 553.305098608486 | 15.6949013915144 |
| 10 | 621 | 553.305098608486 | 67.6949013915144 |
| 11 | 629 | 554.439239731555 | 74.5607602684447 |
| 12 | 628 | 549.902675239277 | 78.0973247607234 |
| 13 | 612 | 556.707521977695 | 55.2924780223054 |
| 14 | 595 | 555.573380854625 | 39.4266191453751 |
| 15 | 597 | 560.109945346904 | 36.8900546530964 |
| 16 | 593 | 564.646509839182 | 28.3534901608177 |
| 17 | 590 | 563.512368716113 | 26.4876312838874 |
| 18 | 580 | 560.109945346904 | 19.8900546530964 |
| 19 | 574 | 561.244086469973 | 12.7559135300267 |
| 20 | 573 | 558.975804223834 | 14.0241957761660 |
| 21 | 573 | 563.512368716113 | 9.48763128388735 |
| 22 | 620 | 563.512368716113 | 56.4876312838874 |
| 23 | 626 | 563.512368716113 | 62.4876312838874 |
| 24 | 620 | 563.512368716113 | 56.4876312838874 |
| 25 | 588 | 568.048933208391 | 19.9510667916087 |
| 26 | 566 | 566.914792085322 | -0.914792085321672 |
| 27 | 557 | 556.707521977695 | 0.292478022305391 |
| 28 | 561 | 564.646509839182 | -3.64650983918232 |
| 29 | 549 | 566.914792085322 | -17.9147920853217 |
| 30 | 532 | 564.646509839182 | -32.6465098391823 |
| 31 | 526 | 568.048933208391 | -42.0489332083913 |
| 32 | 511 | 568.048933208391 | -57.0489332083913 |
| 33 | 499 | 566.914792085322 | -67.9147920853217 |
| 34 | 555 | 564.646509839182 | -9.64650983918232 |
| 35 | 565 | 563.512368716113 | 1.48763128388735 |
| 36 | 542 | 563.512368716113 | -21.5123687161126 |
| 37 | 527 | 564.646509839182 | -37.6465098391823 |
| 38 | 510 | 556.707521977695 | -46.7075219776946 |
| 39 | 514 | 561.244086469973 | -47.2440864699733 |
| 40 | 517 | 558.975804223834 | -41.975804223834 |
| 41 | 508 | 562.378227593043 | -54.378227593043 |
| 42 | 493 | 562.378227593043 | -69.378227593043 |
| 43 | 490 | 557.841663100764 | -67.8416631007643 |
| 44 | 469 | 555.573380854625 | -86.573380854625 |
| 45 | 478 | 553.305098608486 | -75.3050986084856 |
| 46 | 528 | 551.036816362346 | -23.0368163623462 |
| 47 | 534 | 553.305098608486 | -19.3050986084856 |
| 48 | 518 | 555.573380854625 | -37.5733808546249 |
| 49 | 506 | 546.500251870068 | -40.5002518700675 |
| 50 | 502 | 540.829546254719 | -38.8295462547192 |
| 51 | 516 | 537.42712288551 | -21.4271228855102 |
| 52 | 528 | 543.097828500859 | -15.0978285008585 |
| 53 | 533 | 538.56126400858 | -5.56126400857983 |
| 54 | 536 | 538.56126400858 | -2.56126400857983 |
| 55 | 537 | 540.829546254719 | -3.82954625471918 |
| 56 | 524 | 544.231969623928 | -20.2319696239282 |
| 57 | 536 | 545.366110746998 | -9.36611074699787 |
| 58 | 587 | 546.500251870068 | 40.4997481299325 |
| 59 | 597 | 553.305098608486 | 43.6949013915144 |
| 60 | 581 | 553.305098608486 | 27.6949013915144 |
| Goldfeld-Quandt test for Heteroskedasticity | |||
| p-values | Alternative Hypothesis | ||
| breakpoint index | greater | 2-sided | less |
| 5 | 0.015469357775253 | 0.030938715550506 | 0.984530642224747 |
| 6 | 0.00299958991673753 | 0.00599917983347505 | 0.997000410083262 |
| 7 | 0.00404320064990040 | 0.00808640129980079 | 0.9959567993501 |
| 8 | 0.00533862599524203 | 0.0106772519904841 | 0.994661374004758 |
| 9 | 0.00195070080707641 | 0.00390140161415283 | 0.998049299192924 |
| 10 | 0.0095487669170356 | 0.0190975338340712 | 0.990451233082964 |
| 11 | 0.0209497004099759 | 0.0418994008199517 | 0.979050299590024 |
| 12 | 0.0224183622760578 | 0.0448367245521156 | 0.977581637723942 |
| 13 | 0.0170678320864025 | 0.034135664172805 | 0.982932167913597 |
| 14 | 0.0102299322931578 | 0.0204598645863156 | 0.989770067706842 |
| 15 | 0.00609501876795978 | 0.0121900375359196 | 0.99390498123204 |
| 16 | 0.00356407728770665 | 0.00712815457541331 | 0.996435922712293 |
| 17 | 0.0019301316062224 | 0.0038602632124448 | 0.998069868393778 |
| 18 | 0.00119240073022551 | 0.00238480146045103 | 0.998807599269774 |
| 19 | 0.000783068415301409 | 0.00156613683060282 | 0.999216931584699 |
| 20 | 0.000612549452476003 | 0.00122509890495201 | 0.999387450547524 |
| 21 | 0.000337399096880385 | 0.00067479819376077 | 0.99966260090312 |
| 22 | 0.00137818182786673 | 0.00275636365573347 | 0.998621818172133 |
| 23 | 0.00716534209287138 | 0.0143306841857428 | 0.992834657907129 |
| 24 | 0.0227241479337893 | 0.0454482958675787 | 0.97727585206621 |
| 25 | 0.0244216893057329 | 0.0488433786114658 | 0.975578310694267 |
| 26 | 0.0270284068106951 | 0.0540568136213902 | 0.972971593189305 |
| 27 | 0.0460424928281265 | 0.0920849856562531 | 0.953957507171873 |
| 28 | 0.0539602748021227 | 0.107920549604245 | 0.946039725197877 |
| 29 | 0.0655407913476673 | 0.131081582695335 | 0.934459208652333 |
| 30 | 0.106660333762251 | 0.213320667524502 | 0.893339666237749 |
| 31 | 0.132950672586843 | 0.265901345173687 | 0.867049327413157 |
| 32 | 0.186966363176958 | 0.373932726353916 | 0.813033636823042 |
| 33 | 0.293696999256691 | 0.587393998513381 | 0.70630300074331 |
| 34 | 0.271826015698397 | 0.543652031396794 | 0.728173984301603 |
| 35 | 0.289911366395709 | 0.579822732791418 | 0.710088633604291 |
| 36 | 0.284312286295847 | 0.568624572591694 | 0.715687713704153 |
| 37 | 0.278720905339812 | 0.557441810679624 | 0.721279094660188 |
| 38 | 0.417534181700528 | 0.835068363401056 | 0.582465818299472 |
| 39 | 0.439648979432437 | 0.879297958864873 | 0.560351020567563 |
| 40 | 0.458165863023242 | 0.916331726046485 | 0.541834136976758 |
| 41 | 0.456381704703124 | 0.912763409406248 | 0.543618295296876 |
| 42 | 0.502935095805529 | 0.994129808388943 | 0.497064904194471 |
| 43 | 0.609265469502392 | 0.781469060995216 | 0.390734530497608 |
| 44 | 0.856042030204997 | 0.287915939590006 | 0.143957969795003 |
| 45 | 0.966725407733795 | 0.0665491845324102 | 0.0332745922662051 |
| 46 | 0.956003302226774 | 0.0879933955464525 | 0.0439966977732262 |
| 47 | 0.941316114505384 | 0.117367770989232 | 0.0586838854946159 |
| 48 | 0.981516287059766 | 0.036967425880468 | 0.018483712940234 |
| 49 | 0.994798742602888 | 0.0104025147942233 | 0.00520125739711163 |
| 50 | 0.995990057661506 | 0.00801988467698714 | 0.00400994233849357 |
| 51 | 0.989460850306451 | 0.0210782993870975 | 0.0105391496935487 |
| 52 | 0.980673795602782 | 0.0386524087944357 | 0.0193262043972178 |
| 53 | 0.953377067396082 | 0.0932458652078357 | 0.0466229326039179 |
| 54 | 0.908426024597958 | 0.183147950804083 | 0.0915739754020417 |
| 55 | 0.815779442548782 | 0.368441114902436 | 0.184220557451218 |
| Meta Analysis of Goldfeld-Quandt test for Heteroskedasticity | |||
| Description | # significant tests | % significant tests | OK/NOK |
| 1% type I error level | 11 | 0.215686274509804 | NOK |
| 5% type I error level | 26 | 0.509803921568627 | NOK |
| 10% type I error level | 31 | 0.607843137254902 | NOK |