| Multiple Linear Regression - Estimated Regression Equation |
| Y[t] = + 5.05136942371016 -0.0187338824930496X[t] + 1.05792207436861Y1[t] -0.418657763778208Y2[t] -0.0092399573649387t + e[t] |
| Multiple Linear Regression - Ordinary Least Squares | |||||
| Variable | Parameter | S.D. | T-STAT H0: parameter = 0 | 2-tail p-value | 1-tail p-value |
| (Intercept) | 5.05136942371016 | 0.695912 | 7.2586 | 0 | 0 |
| X | -0.0187338824930496 | 0.003139 | -5.9687 | 0 | 0 |
| Y1 | 1.05792207436861 | 0.099071 | 10.6784 | 0 | 0 |
| Y2 | -0.418657763778208 | 0.098669 | -4.2431 | 8.9e-05 | 4.4e-05 |
| t | -0.0092399573649387 | 0.002802 | -3.2979 | 0.001744 | 0.000872 |
| Multiple Linear Regression - Regression Statistics | |
| Multiple R | 0.947184344706652 |
| R-squared | 0.89715818285737 |
| Adjusted R-squared | 0.889396536280568 |
| F-TEST (value) | 115.588641402298 |
| F-TEST (DF numerator) | 4 |
| F-TEST (DF denominator) | 53 |
| p-value | 0 |
| Multiple Linear Regression - Residual Statistics | |
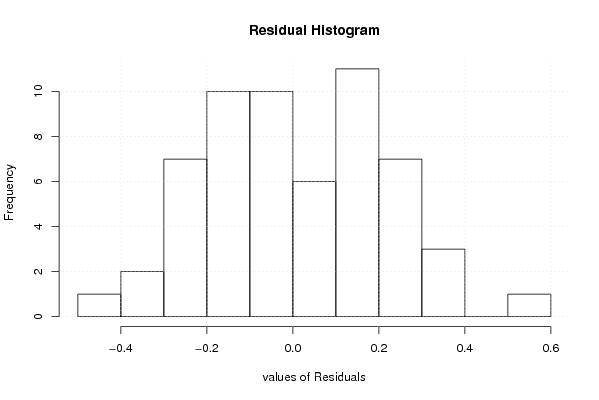
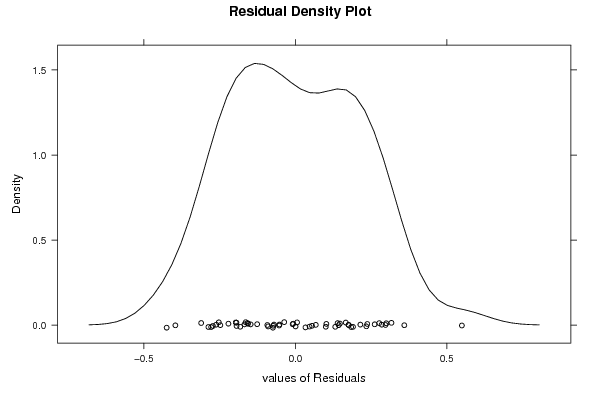
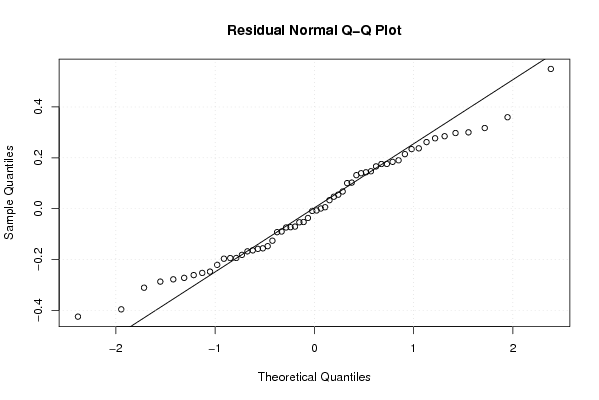
| Residual Standard Deviation | 0.221574875791143 |
| Sum Squared Residuals | 2.60205755583859 |
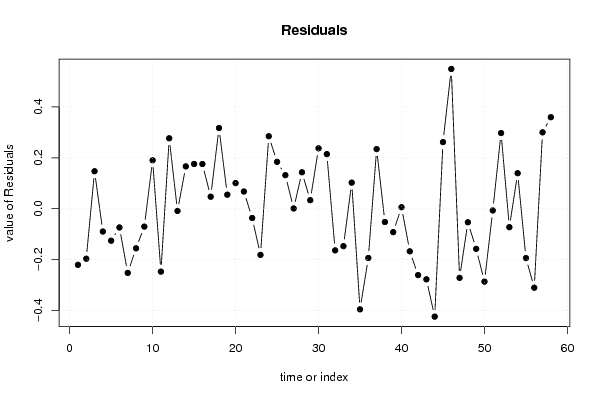
| Multiple Linear Regression - Actuals, Interpolation, and Residuals | |||
| Time or Index | Actuals | Interpolation Forecast | Residuals Prediction Error |
| 1 | 8.7 | 8.92094031585258 | -0.220940315852585 |
| 2 | 8.2 | 8.39684396182199 | -0.196843961821989 |
| 3 | 8.3 | 8.15292555527368 | 0.147074444726316 |
| 4 | 8.5 | 8.58994386468606 | -0.0899438646860576 |
| 5 | 8.6 | 8.72606849857605 | -0.126068498576054 |
| 6 | 8.5 | 8.5740310299535 | -0.0740310299534974 |
| 7 | 8.2 | 8.45272746551067 | -0.252727465510673 |
| 8 | 8.1 | 8.2560259099303 | -0.156025909930305 |
| 9 | 7.9 | 7.97059573087178 | -0.0705957308717822 |
| 10 | 8.6 | 8.40985525728158 | 0.190144742718417 |
| 11 | 8.7 | 8.94763084383318 | -0.247630843833176 |
| 12 | 8.7 | 8.42327971563198 | 0.276720284368016 |
| 13 | 8.5 | 8.50893132408849 | -0.00893132408848618 |
| 14 | 8.4 | 8.23377869261998 | 0.166221307380018 |
| 15 | 8.5 | 8.32424831677865 | 0.175751683221353 |
| 16 | 8.7 | 8.52448815545545 | 0.175511844544545 |
| 17 | 8.7 | 8.65311923634823 | 0.0468807636517683 |
| 18 | 8.6 | 8.28288626533052 | 0.317113734669484 |
| 19 | 8.5 | 8.44511556142585 | 0.0548844385741481 |
| 20 | 8.3 | 8.19959745406582 | 0.100402545934184 |
| 21 | 8 | 7.93258961048764 | 0.067410389512356 |
| 22 | 8.2 | 8.23673395236481 | -0.0367339523648140 |
| 23 | 8.1 | 8.28179411336201 | -0.181794113362009 |
| 24 | 8.1 | 7.81513587615396 | 0.284864123846042 |
| 25 | 8 | 7.81591409492866 | 0.184085905071345 |
| 26 | 7.9 | 7.76832390710184 | 0.131676092898166 |
| 27 | 7.9 | 7.8993568378521 | 0.00064316214790279 |
| 28 | 8 | 7.85704712689278 | 0.142952873107219 |
| 29 | 8 | 7.96671309470984 | 0.0332869052901626 |
| 30 | 7.9 | 7.66269994731091 | 0.237300052689093 |
| 31 | 8 | 7.78558809017084 | 0.214411909829161 |
| 32 | 7.7 | 7.86405769264282 | -0.164057692642823 |
| 33 | 7.2 | 7.34757766489439 | -0.147577664894388 |
| 34 | 7.5 | 7.39770089705693 | 0.102299102943066 |
| 35 | 7.3 | 7.695980018723 | -0.395980018723001 |
| 36 | 7 | 7.19406709265857 | -0.194067092658566 |
| 37 | 7 | 6.7657166290575 | 0.234283370942506 |
| 38 | 7 | 7.05255233151277 | -0.0525523315127703 |
| 39 | 7.2 | 7.29247301130539 | -0.092473011305392 |
| 40 | 7.3 | 7.29436492613854 | 0.00563507386145595 |
| 41 | 7.1 | 7.26784447021942 | -0.167844470219420 |
| 42 | 6.8 | 7.06135596908209 | -0.261355969082088 |
| 43 | 6.4 | 6.67796682346434 | -0.277966823464335 |
| 44 | 6.1 | 6.52477320192842 | -0.424773201928424 |
| 45 | 6.5 | 6.23822932681145 | 0.261770673188553 |
| 46 | 7.7 | 7.1505597899391 | 0.549440210060898 |
| 47 | 7.9 | 8.17217446283162 | -0.272174462831622 |
| 48 | 7.5 | 7.55365360142471 | -0.0536536014247121 |
| 49 | 6.9 | 7.05812053229904 | -0.158120532299042 |
| 50 | 6.6 | 6.88695272046093 | -0.286952720460932 |
| 51 | 6.9 | 6.90707359976689 | -0.00707359976688766 |
| 52 | 7.7 | 7.40262940607306 | 0.297370593926941 |
| 53 | 8 | 8.07291523758484 | -0.072915237584835 |
| 54 | 8 | 7.86066025482672 | 0.139339745173279 |
| 55 | 7.7 | 7.89442791076577 | -0.194427910765767 |
| 56 | 7.3 | 7.61089926082426 | -0.310899260824260 |
| 57 | 7.4 | 7.0998884836711 | 0.300111516328902 |
| 58 | 8.1 | 7.7404548773646 | 0.359545122635397 |
| Goldfeld-Quandt test for Heteroskedasticity | |||
| p-values | Alternative Hypothesis | ||
| breakpoint index | greater | 2-sided | less |
| 8 | 0.0359755850833632 | 0.0719511701667265 | 0.964024414916637 |
| 9 | 0.0413270171542474 | 0.0826540343084948 | 0.958672982845753 |
| 10 | 0.106252714052201 | 0.212505428104402 | 0.893747285947799 |
| 11 | 0.0587287618538226 | 0.117457523707645 | 0.941271238146177 |
| 12 | 0.309462314920359 | 0.618924629840718 | 0.690537685079641 |
| 13 | 0.220460736940989 | 0.440921473881978 | 0.779539263059011 |
| 14 | 0.146908895731286 | 0.293817791462572 | 0.853091104268714 |
| 15 | 0.0928965208354048 | 0.185793041670810 | 0.907103479164595 |
| 16 | 0.0570079068545938 | 0.114015813709188 | 0.942992093145406 |
| 17 | 0.034860604700073 | 0.069721209400146 | 0.965139395299927 |
| 18 | 0.0276666931837042 | 0.0553333863674083 | 0.972333306816296 |
| 19 | 0.0233409947484227 | 0.0466819894968453 | 0.976659005251577 |
| 20 | 0.0175714714675325 | 0.0351429429350650 | 0.982428528532467 |
| 21 | 0.0167225340157463 | 0.0334450680314926 | 0.983277465984254 |
| 22 | 0.0187271213245380 | 0.0374542426490761 | 0.981272878675462 |
| 23 | 0.0343601608992298 | 0.0687203217984595 | 0.96563983910077 |
| 24 | 0.0267879313871812 | 0.0535758627743624 | 0.973212068612819 |
| 25 | 0.0183825112953664 | 0.0367650225907329 | 0.981617488704634 |
| 26 | 0.0127269753966484 | 0.0254539507932968 | 0.987273024603352 |
| 27 | 0.00967715832015302 | 0.0193543166403060 | 0.990322841679847 |
| 28 | 0.00602741465280708 | 0.0120548293056142 | 0.993972585347193 |
| 29 | 0.0038593490837472 | 0.0077186981674944 | 0.996140650916253 |
| 30 | 0.00422618650491524 | 0.00845237300983047 | 0.995773813495085 |
| 31 | 0.0052743032853768 | 0.0105486065707536 | 0.994725696714623 |
| 32 | 0.009822588015903 | 0.019645176031806 | 0.990177411984097 |
| 33 | 0.0190841973438305 | 0.038168394687661 | 0.98091580265617 |
| 34 | 0.0254988483396822 | 0.0509976966793644 | 0.974501151660318 |
| 35 | 0.0458535090233887 | 0.0917070180467775 | 0.954146490976611 |
| 36 | 0.0410679967547569 | 0.0821359935095138 | 0.958932003245243 |
| 37 | 0.0930832311451965 | 0.186166462290393 | 0.906916768854804 |
| 38 | 0.0745825797021078 | 0.149165159404216 | 0.925417420297892 |
| 39 | 0.0689181307624017 | 0.137836261524803 | 0.931081869237598 |
| 40 | 0.0910304452813795 | 0.182060890562759 | 0.90896955471862 |
| 41 | 0.109148256005978 | 0.218296512011957 | 0.890851743994022 |
| 42 | 0.190288939024930 | 0.380577878049861 | 0.80971106097507 |
| 43 | 0.160804444908831 | 0.321608889817662 | 0.839195555091169 |
| 44 | 0.241426492442936 | 0.482852984885872 | 0.758573507557064 |
| 45 | 0.294824928612561 | 0.589649857225122 | 0.705175071387439 |
| 46 | 0.825666411447065 | 0.34866717710587 | 0.174333588552935 |
| 47 | 0.800972926268687 | 0.398054147462626 | 0.199027073731313 |
| 48 | 0.739952489672282 | 0.520095020655437 | 0.260047510327719 |
| 49 | 0.655390745227448 | 0.689218509545104 | 0.344609254772552 |
| 50 | 0.498680872511527 | 0.997361745023055 | 0.501319127488473 |
| Meta Analysis of Goldfeld-Quandt test for Heteroskedasticity | |||
| Description | # significant tests | % significant tests | OK/NOK |
| 1% type I error level | 2 | 0.0465116279069767 | NOK |
| 5% type I error level | 13 | 0.302325581395349 | NOK |
| 10% type I error level | 22 | 0.511627906976744 | NOK |