| Multiple Linear Regression - Estimated Regression Equation |
| Y[t] = + 4.56263427303848 -0.0175379205114101X[t] + 1.11287158351717Y1[t] -0.505979172235887Y2[t] + 0.0744444233726834Y3[t] -0.0082845241626587t + e[t] |
| Multiple Linear Regression - Ordinary Least Squares | |||||
| Variable | Parameter | S.D. | T-STAT H0: parameter = 0 | 2-tail p-value | 1-tail p-value |
| (Intercept) | 4.56263427303848 | 0.932637 | 4.8922 | 1e-05 | 5e-06 |
| X | -0.0175379205114101 | 0.003539 | -4.9562 | 8e-06 | 4e-06 |
| Y1 | 1.11287158351717 | 0.125019 | 8.9016 | 0 | 0 |
| Y2 | -0.505979172235887 | 0.182097 | -2.7786 | 0.007623 | 0.003811 |
| Y3 | 0.0744444233726834 | 0.127874 | 0.5822 | 0.563017 | 0.281508 |
| t | -0.0082845241626587 | 0.003277 | -2.5277 | 0.014621 | 0.007311 |
| Multiple Linear Regression - Regression Statistics | |
| Multiple R | 0.946941707853524 |
| R-squared | 0.89669859807255 |
| Adjusted R-squared | 0.88657100964829 |
| F-TEST (value) | 88.5401894812963 |
| F-TEST (DF numerator) | 5 |
| F-TEST (DF denominator) | 51 |
| p-value | 0 |
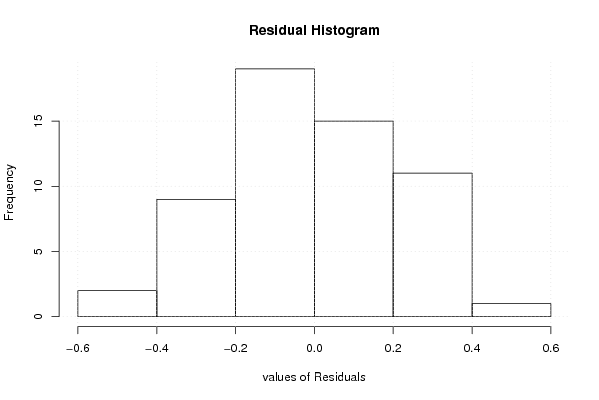
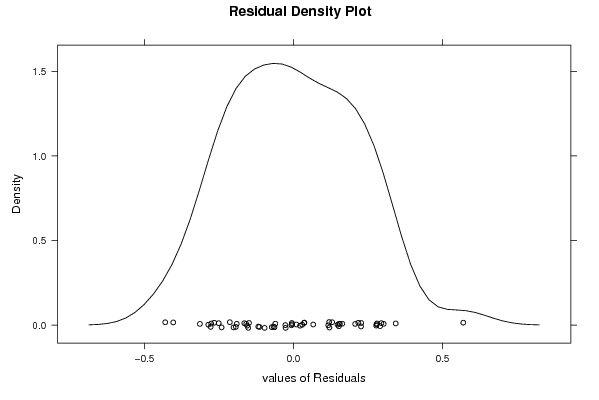
| Multiple Linear Regression - Residual Statistics | |
| Residual Standard Deviation | 0.222763915082659 |
| Sum Squared Residuals | 2.53081185501066 |
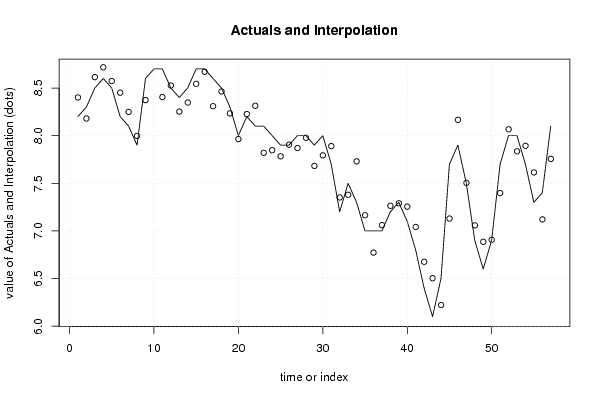
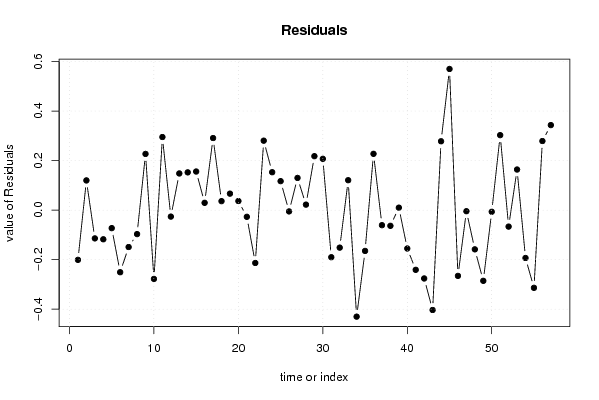
| Multiple Linear Regression - Actuals, Interpolation, and Residuals | |||
| Time or Index | Actuals | Interpolation Forecast | Residuals Prediction Error |
| 1 | 8.2 | 8.40086941991187 | -0.200869419911869 |
| 2 | 8.3 | 8.1800738245084 | 0.119926175491602 |
| 3 | 8.5 | 8.61416483437166 | -0.114164834371665 |
| 4 | 8.6 | 8.71783520133767 | -0.117835201337670 |
| 5 | 8.5 | 8.5727527429164 | -0.0727527429164101 |
| 6 | 8.2 | 8.45079407682466 | -0.250794076824663 |
| 7 | 8.1 | 8.24911866357134 | -0.149118663571338 |
| 8 | 7.9 | 7.99679714631018 | -0.09679714631018 |
| 9 | 8.6 | 8.3729542725324 | 0.227045727467594 |
| 10 | 8.7 | 8.9778700253728 | -0.277870025372803 |
| 11 | 8.7 | 8.40488474537253 | 0.295115254627473 |
| 12 | 8.5 | 8.52614022008045 | -0.0261402200804513 |
| 13 | 8.4 | 8.25186585206854 | 0.148134147931461 |
| 14 | 8.5 | 8.3474864873255 | 0.152513512674493 |
| 15 | 8.7 | 8.54407329175127 | 0.155926708248730 |
| 16 | 8.7 | 8.67050625986179 | 0.0294937401382100 |
| 17 | 8.6 | 8.30890912002035 | 0.291090879979647 |
| 18 | 8.5 | 8.46378754574938 | 0.0362124542506163 |
| 19 | 8.3 | 8.23346491175362 | 0.0665350882463766 |
| 20 | 8 | 7.96333131937023 | 0.0366686806297745 |
| 21 | 8.2 | 8.2270439911955 | -0.0270439911955003 |
| 22 | 8.1 | 8.31341605101021 | -0.213416051010211 |
| 23 | 8.1 | 7.81952294372369 | 0.280477056276311 |
| 24 | 8 | 7.84691075658976 | 0.153089243410242 |
| 25 | 7.9 | 7.78303114557919 | 0.116968854420809 |
| 26 | 7.9 | 7.90522071386278 | -0.00522071386277465 |
| 27 | 8 | 7.8699379825408 | 0.130062017459204 |
| 28 | 8 | 7.97777271875057 | 0.0222272812494275 |
| 29 | 7.9 | 7.68212835046029 | 0.217871649539712 |
| 30 | 8 | 7.79273270077809 | 0.207267299221910 |
| 31 | 7.7 | 7.89021190655422 | -0.190211906554224 |
| 32 | 7.2 | 7.35147397573542 | -0.151473975735419 |
| 33 | 7.5 | 7.37917849045404 | 0.120821509545960 |
| 34 | 7.3 | 7.73021803046917 | -0.430218030469172 |
| 35 | 7 | 7.16477848600127 | -0.164778486001268 |
| 36 | 7 | 6.77253623517948 | 0.227463764820518 |
| 37 | 7 | 7.06075165466688 | -0.060751654666884 |
| 38 | 7.2 | 7.26338814629417 | -0.0633881462941747 |
| 39 | 7.3 | 7.29002218936286 | 0.00997781063713825 |
| 40 | 7.1 | 7.25499935603078 | -0.154999356030781 |
| 41 | 6.8 | 7.04104524414987 | -0.241045244149867 |
| 42 | 6.4 | 6.67600511788093 | -0.276005117880928 |
| 43 | 6.1 | 6.5032877755012 | -0.403287775501195 |
| 44 | 6.5 | 6.22194225868835 | 0.278057741311654 |
| 45 | 7.7 | 7.12982696843131 | 0.570173031568691 |
| 46 | 7.9 | 8.16561925063973 | -0.265619250639732 |
| 47 | 7.5 | 7.50436715715255 | -0.00436715715254513 |
| 48 | 6.9 | 7.05836318574561 | -0.158363185745613 |
| 49 | 6.6 | 6.88550436937753 | -0.285504369377531 |
| 50 | 6.9 | 6.90661149876037 | -0.00661149876037031 |
| 51 | 7.7 | 7.39719068498767 | 0.302809315012327 |
| 52 | 8 | 8.06649292383107 | -0.0664929238310741 |
| 53 | 8 | 7.8359944508837 | 0.164005549116299 |
| 54 | 7.7 | 7.89331299835111 | -0.193312998351114 |
| 55 | 7.3 | 7.61383754332135 | -0.313837543321354 |
| 56 | 7.4 | 7.12103480384822 | 0.278965196151777 |
| 57 | 8.1 | 7.75660798219918 | 0.343392017800824 |
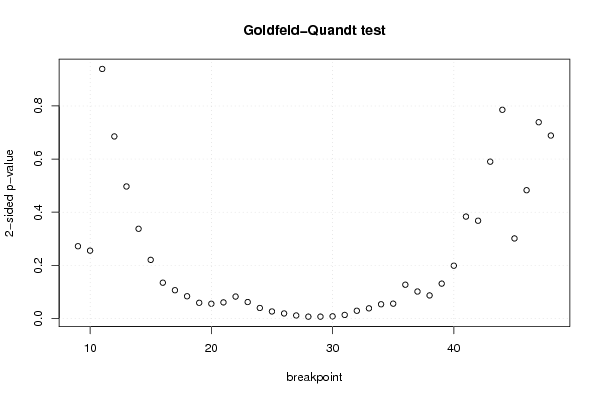
| Goldfeld-Quandt test for Heteroskedasticity | |||
| p-values | Alternative Hypothesis | ||
| breakpoint index | greater | 2-sided | less |
| 9 | 0.136037830364078 | 0.272075660728156 | 0.863962169635922 |
| 10 | 0.127742922435929 | 0.255485844871857 | 0.872257077564071 |
| 11 | 0.469709634607101 | 0.939419269214203 | 0.530290365392899 |
| 12 | 0.342688888707516 | 0.685377777415033 | 0.657311111292484 |
| 13 | 0.248493382167568 | 0.496986764335137 | 0.751506617832432 |
| 14 | 0.168846467818522 | 0.337692935637045 | 0.831153532181478 |
| 15 | 0.110363116340142 | 0.220726232680284 | 0.889636883659858 |
| 16 | 0.0673959283883964 | 0.134791856776793 | 0.932604071611604 |
| 17 | 0.053230723131857 | 0.106461446263714 | 0.946769276868143 |
| 18 | 0.0418575146189453 | 0.0837150292378907 | 0.958142485381055 |
| 19 | 0.0295304837754423 | 0.0590609675508847 | 0.970469516224558 |
| 20 | 0.0277488777441011 | 0.0554977554882022 | 0.97225112225590 |
| 21 | 0.0303516023019395 | 0.060703204603879 | 0.96964839769806 |
| 22 | 0.0412900335196967 | 0.0825800670393933 | 0.958709966480303 |
| 23 | 0.0309499442687708 | 0.0618998885375416 | 0.96905005573123 |
| 24 | 0.0197786248995422 | 0.0395572497990843 | 0.980221375100458 |
| 25 | 0.0132477508499499 | 0.0264955016998999 | 0.98675224915005 |
| 26 | 0.00948585514355937 | 0.0189717102871187 | 0.99051414485644 |
| 27 | 0.00567275939108807 | 0.0113455187821761 | 0.994327240608912 |
| 28 | 0.00348173856956286 | 0.00696347713912572 | 0.996518261430437 |
| 29 | 0.00346267095019548 | 0.00692534190039096 | 0.996537329049805 |
| 30 | 0.00409561310255039 | 0.00819122620510078 | 0.99590438689745 |
| 31 | 0.00669591769112131 | 0.0133918353822426 | 0.993304082308879 |
| 32 | 0.0145380559582981 | 0.0290761119165961 | 0.985461944041702 |
| 33 | 0.0191427087283043 | 0.0382854174566086 | 0.980857291271696 |
| 34 | 0.0267794108781365 | 0.0535588217562729 | 0.973220589121863 |
| 35 | 0.0278935672396622 | 0.0557871344793244 | 0.972106432760338 |
| 36 | 0.0635677611421891 | 0.127135522284378 | 0.936432238857811 |
| 37 | 0.0507479147563507 | 0.101495829512701 | 0.94925208524365 |
| 38 | 0.0434316243988446 | 0.0868632487976892 | 0.956568375601155 |
| 39 | 0.0656427405889232 | 0.131285481177846 | 0.934357259411077 |
| 40 | 0.0993914254407714 | 0.198782850881543 | 0.900608574559229 |
| 41 | 0.191813012167737 | 0.383626024335474 | 0.808186987832263 |
| 42 | 0.184014981637450 | 0.368029963274899 | 0.81598501836255 |
| 43 | 0.295186682128474 | 0.590373364256949 | 0.704813317871526 |
| 44 | 0.392811891247157 | 0.785623782494315 | 0.607188108752843 |
| 45 | 0.849322880546909 | 0.301354238906182 | 0.150677119453091 |
| 46 | 0.758540813577627 | 0.482918372844746 | 0.241459186422373 |
| 47 | 0.630603367696482 | 0.738793264607035 | 0.369396632303518 |
| 48 | 0.655637035277866 | 0.688725929444268 | 0.344362964722134 |
| Meta Analysis of Goldfeld-Quandt test for Heteroskedasticity | |||
| Description | # significant tests | % significant tests | OK/NOK |
| 1% type I error level | 3 | 0.075 | NOK |
| 5% type I error level | 10 | 0.25 | NOK |
| 10% type I error level | 19 | 0.475 | NOK |