| Multiple Linear Regression - Estimated Regression Equation |
| Werkloosheidsgraad[t] = + 8.54364253391526 -0.0101361098022254Bruto_index[t] -0.0141856472841194t + e[t] |
| Multiple Linear Regression - Ordinary Least Squares | |||||
| Variable | Parameter | S.D. | T-STAT H0: parameter = 0 | 2-tail p-value | 1-tail p-value |
| (Intercept) | 8.54364253391526 | 0.469041 | 18.2151 | 0 | 0 |
| Bruto_index | -0.0101361098022254 | 0.004804 | -2.1101 | 0.039172 | 0.019586 |
| t | -0.0141856472841194 | 0.004404 | -3.2213 | 0.002094 | 0.001047 |
| Multiple Linear Regression - Regression Statistics | |
| Multiple R | 0.442544168297874 |
| R-squared | 0.195845340894457 |
| Adjusted R-squared | 0.168115869890817 |
| F-TEST (value) | 7.06271464279836 |
| F-TEST (DF numerator) | 2 |
| F-TEST (DF denominator) | 58 |
| p-value | 0.00179824098813464 |
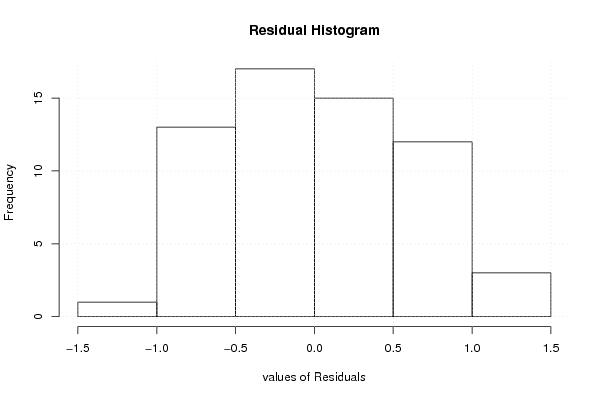
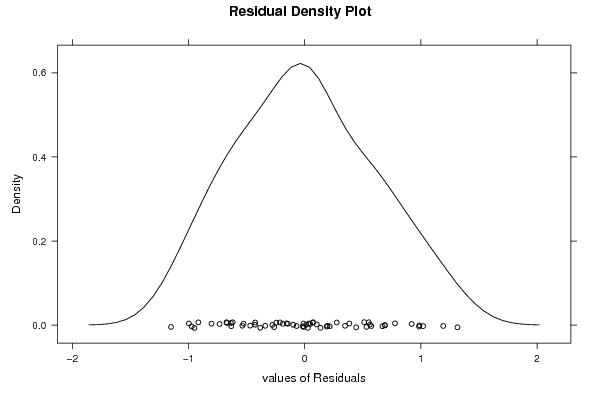
| Multiple Linear Regression - Residual Statistics | |
| Residual Standard Deviation | 0.604653831924191 |
| Sum Squared Residuals | 21.2051628747152 |
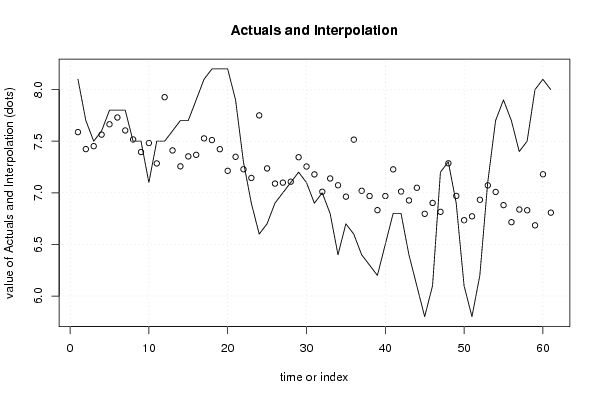
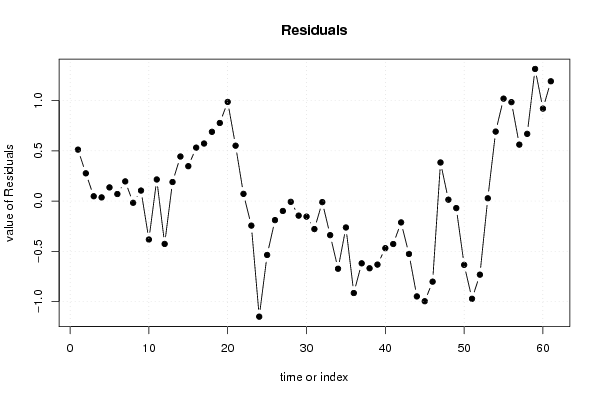
| Multiple Linear Regression - Actuals, Interpolation, and Residuals | |||
| Time or Index | Actuals | Interpolation Forecast | Residuals Prediction Error |
| 1 | 8.1 | 7.5878122860044 | 0.512187713995596 |
| 2 | 7.7 | 7.42361221364735 | 0.276387786352654 |
| 3 | 7.5 | 7.45199822753258 | 0.0480017724674245 |
| 4 | 7.6 | 7.56350034179605 | 0.0364996582039497 |
| 5 | 7.8 | 7.66385273527708 | 0.136147264722922 |
| 6 | 7.8 | 7.72974235543054 | 0.0702576445694606 |
| 7 | 7.8 | 7.60405950032194 | 0.195940499678060 |
| 8 | 7.5 | 7.5168938624618 | -0.0168938624617976 |
| 9 | 7.5 | 7.39526545127409 | 0.104734548725912 |
| 10 | 7.1 | 7.48244090201222 | -0.382440902012224 |
| 11 | 7.5 | 7.28479166730782 | 0.215208332692176 |
| 12 | 7.5 | 7.92641232422769 | -0.426412324227690 |
| 13 | 7.6 | 7.41048924173341 | 0.189510758266588 |
| 14 | 7.7 | 7.25642527917858 | 0.443574720821419 |
| 15 | 7.7 | 7.35272322873872 | 0.347276771261281 |
| 16 | 7.9 | 7.36793229988105 | 0.532067700118947 |
| 17 | 8.1 | 7.52707413021499 | 0.572925869785011 |
| 18 | 8.2 | 7.51086126097042 | 0.689138739029575 |
| 19 | 8.2 | 7.42268201213006 | 0.777317987869941 |
| 20 | 8.2 | 7.21286944566299 | 0.98713055433701 |
| 21 | 7.9 | 7.3486982234518 | 0.551301776548195 |
| 22 | 7.3 | 7.22808342324432 | 0.0719165767556809 |
| 23 | 6.9 | 7.14395861832484 | -0.243958618324844 |
| 24 | 6.6 | 7.75010289093692 | -1.15010289093692 |
| 25 | 6.7 | 7.23620703040309 | -0.536207030403087 |
| 26 | 6.9 | 7.08923834470982 | -0.189238344709815 |
| 27 | 7 | 7.09836574997081 | -0.0983657499708142 |
| 28 | 7.1 | 7.10749315523181 | -0.00749315523181361 |
| 29 | 7.2 | 7.34468303104288 | -0.144683031042884 |
| 30 | 7.1 | 7.25447656024207 | -0.154476560242075 |
| 31 | 6.9 | 7.17846064316438 | -0.278460643164379 |
| 32 | 7 | 7.01020612688643 | -0.0102061268864337 |
| 33 | 6.8 | 7.1389396278137 | -0.338939627813693 |
| 34 | 6.4 | 7.07305982053822 | -0.673059820538223 |
| 35 | 6.7 | 6.96258113013296 | -0.262581130132963 |
| 36 | 6.6 | 7.51500402079324 | -0.915004020793245 |
| 37 | 6.4 | 7.01935315790342 | -0.619353157903417 |
| 38 | 6.3 | 6.96867751533129 | -0.668677515331287 |
| 39 | 6.2 | 6.83184493944024 | -0.631844939440239 |
| 40 | 6.5 | 6.96868732820928 | -0.468687328209279 |
| 41 | 6.8 | 7.22716303460502 | -0.427163034605024 |
| 42 | 6.8 | 7.01228241323684 | -0.212282413236841 |
| 43 | 6.4 | 6.92613038635692 | -0.52613038635692 |
| 44 | 6.1 | 7.04878222140284 | -0.948782221402845 |
| 45 | 5.8 | 6.79639799376643 | -0.996397993766427 |
| 46 | 6.1 | 6.90181844214857 | -0.801818442148568 |
| 47 | 7.2 | 6.81566641526865 | 0.384333584731352 |
| 48 | 7.3 | 7.2859868165309 | 0.0140131834690957 |
| 49 | 6.9 | 6.96974509714047 | -0.0697450971404664 |
| 50 | 6.1 | 6.73459225616783 | -0.634592256167833 |
| 51 | 5.8 | 6.77210076887506 | -0.972100768875063 |
| 52 | 6.2 | 6.93225621018922 | -0.73225621018922 |
| 53 | 7.1 | 7.07213943189893 | 0.0278605681010714 |
| 54 | 7.7 | 7.0082868465839 | 0.691713153416096 |
| 55 | 7.9 | 6.88057676951486 | 1.01942323048514 |
| 56 | 7.7 | 6.71536308617758 | 0.984636913822419 |
| 57 | 7.4 | 6.8380149212235 | 0.561985078776495 |
| 58 | 7.5 | 6.83092455080094 | 0.669075449199056 |
| 59 | 8 | 6.68496947608789 | 1.31503052391211 |
| 60 | 8.1 | 7.17961654087549 | 0.920383459124509 |
| 61 | 8 | 6.80762621757281 | 1.19237378242719 |
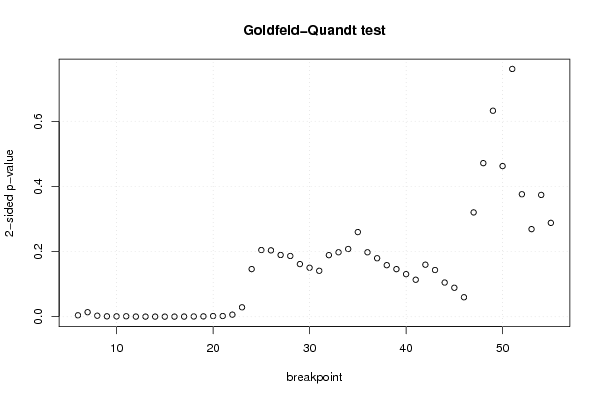
| Goldfeld-Quandt test for Heteroskedasticity | |||
| p-values | Alternative Hypothesis | ||
| breakpoint index | greater | 2-sided | less |
| 6 | 0.00216695892577810 | 0.00433391785155621 | 0.997833041074222 |
| 7 | 0.00692269567386608 | 0.0138453913477322 | 0.993077304326134 |
| 8 | 0.00154682033512742 | 0.00309364067025484 | 0.998453179664873 |
| 9 | 0.000604379160425753 | 0.00120875832085151 | 0.999395620839574 |
| 10 | 0.000580919113650867 | 0.00116183822730173 | 0.99941908088635 |
| 11 | 0.000666417062419629 | 0.00133283412483926 | 0.99933358293758 |
| 12 | 0.000202347598327799 | 0.000404695196655598 | 0.999797652401672 |
| 13 | 0.00015609141438329 | 0.00031218282876658 | 0.999843908585617 |
| 14 | 0.000166140753918378 | 0.000332281507836756 | 0.999833859246082 |
| 15 | 9.57662776240625e-05 | 0.000191532555248125 | 0.999904233722376 |
| 16 | 0.000117862555367309 | 0.000235725110734617 | 0.999882137444633 |
| 17 | 0.000223209246317802 | 0.000446418492635605 | 0.999776790753682 |
| 18 | 0.000377318768571976 | 0.000754637537143951 | 0.999622681231428 |
| 19 | 0.000530284837311999 | 0.00106056967462400 | 0.999469715162688 |
| 20 | 0.00103921015247825 | 0.00207842030495649 | 0.998960789847522 |
| 21 | 0.00104757750406639 | 0.00209515500813278 | 0.998952422495934 |
| 22 | 0.00315559085489962 | 0.00631118170979924 | 0.9968444091451 |
| 23 | 0.0144565657174011 | 0.0289131314348022 | 0.985543434282599 |
| 24 | 0.0730840848984758 | 0.146168169796952 | 0.926915915101524 |
| 25 | 0.102331129878426 | 0.204662259756851 | 0.897668870121574 |
| 26 | 0.101879083991794 | 0.203758167983588 | 0.898120916008206 |
| 27 | 0.094745689060154 | 0.189491378120308 | 0.905254310939846 |
| 28 | 0.093219868838307 | 0.186439737676614 | 0.906780131161693 |
| 29 | 0.0808180620915144 | 0.161636124183029 | 0.919181937908486 |
| 30 | 0.075152165184072 | 0.150304330368144 | 0.924847834815928 |
| 31 | 0.0704782854726402 | 0.140956570945280 | 0.92952171452736 |
| 32 | 0.0944883312118635 | 0.188976662423727 | 0.905511668788136 |
| 33 | 0.0989024646628162 | 0.197804929325632 | 0.901097535337184 |
| 34 | 0.103942004978206 | 0.207884009956412 | 0.896057995021794 |
| 35 | 0.129944905625151 | 0.259889811250302 | 0.870055094374849 |
| 36 | 0.0988909050057785 | 0.197781810011557 | 0.901109094994222 |
| 37 | 0.0897597706280734 | 0.179519541256147 | 0.910240229371927 |
| 38 | 0.0791233835874551 | 0.158246767174910 | 0.920876616412545 |
| 39 | 0.0730372072000101 | 0.146074414400020 | 0.92696279279999 |
| 40 | 0.065354059693066 | 0.130708119386132 | 0.934645940306934 |
| 41 | 0.0567343374520642 | 0.113468674904128 | 0.943265662547936 |
| 42 | 0.0798611957334425 | 0.159722391466885 | 0.920138804266557 |
| 43 | 0.0716691173786688 | 0.143338234757338 | 0.928330882621331 |
| 44 | 0.0524494062421316 | 0.104898812484263 | 0.947550593757868 |
| 45 | 0.0444432466766481 | 0.0888864933532963 | 0.955556753323352 |
| 46 | 0.0298691577610828 | 0.0597383155221656 | 0.970130842238917 |
| 47 | 0.160117565517789 | 0.320235131035577 | 0.839882434482211 |
| 48 | 0.235734839991908 | 0.471469679983817 | 0.764265160008092 |
| 49 | 0.316163679732988 | 0.632327359465975 | 0.683836320267012 |
| 50 | 0.231220510060614 | 0.462441020121227 | 0.768779489939386 |
| 51 | 0.380309925575024 | 0.760619851150049 | 0.619690074424976 |
| 52 | 0.81200017037042 | 0.37599965925916 | 0.18799982962958 |
| 53 | 0.865576381974384 | 0.268847236051232 | 0.134423618025616 |
| 54 | 0.813074862823922 | 0.373850274352156 | 0.186925137176078 |
| 55 | 0.855954383840418 | 0.288091232319163 | 0.144045616159582 |
| Meta Analysis of Goldfeld-Quandt test for Heteroskedasticity | |||
| Description | # significant tests | % significant tests | OK/NOK |
| 1% type I error level | 16 | 0.32 | NOK |
| 5% type I error level | 18 | 0.36 | NOK |
| 10% type I error level | 20 | 0.4 | NOK |