| Multiple Linear Regression - Estimated Regression Equation |
| Werkloosheidsgraad[t] = + 8.81968142713807 -0.032329859077164Bruto_index[t] + 1.43638244834049M1[t] + 1.56603495330607M2[t] + 1.39878884642556M3[t] + 1.29743004719855M4[t] + 1.02122293318781M5[t] + 1.29963924266591M6[t] + 1.49573623918489M7[t] + 1.63441962443005M8[t] + 1.36075205836195M9[t] + 1.11613685283547M10[t] + 1.8491789139581M11[t] + e[t] |
| Multiple Linear Regression - Ordinary Least Squares | |||||
| Variable | Parameter | S.D. | T-STAT H0: parameter = 0 | 2-tail p-value | 1-tail p-value |
| (Intercept) | 8.81968142713807 | 0.824406 | 10.6982 | 0 | 0 |
| Bruto_index | -0.032329859077164 | 0.015517 | -2.0835 | 0.04255 | 0.021275 |
| M1 | 1.43638244834049 | 0.77434 | 1.855 | 0.069747 | 0.034874 |
| M2 | 1.56603495330607 | 0.982529 | 1.5939 | 0.117527 | 0.058763 |
| M3 | 1.39878884642556 | 0.953527 | 1.467 | 0.148908 | 0.074454 |
| M4 | 1.29743004719855 | 0.818321 | 1.5855 | 0.119425 | 0.059712 |
| M5 | 1.02122293318781 | 0.585976 | 1.7428 | 0.087777 | 0.043889 |
| M6 | 1.29963924266591 | 0.640737 | 2.0284 | 0.048093 | 0.024046 |
| M7 | 1.49573623918489 | 0.745156 | 2.0073 | 0.050368 | 0.025184 |
| M8 | 1.63441962443005 | 0.858452 | 1.9039 | 0.062925 | 0.031463 |
| M9 | 1.36075205836195 | 0.836164 | 1.6274 | 0.110205 | 0.055103 |
| M10 | 1.11613685283547 | 0.817791 | 1.3648 | 0.178674 | 0.089337 |
| M11 | 1.8491789139581 | 0.966608 | 1.9131 | 0.061716 | 0.030858 |
| Multiple Linear Regression - Regression Statistics | |
| Multiple R | 0.423372626977428 |
| R-squared | 0.179244381273768 |
| Adjusted R-squared | -0.0259445234077893 |
| F-TEST (value) | 0.873557863920304 |
| F-TEST (DF numerator) | 12 |
| F-TEST (DF denominator) | 48 |
| p-value | 0.578201528447169 |
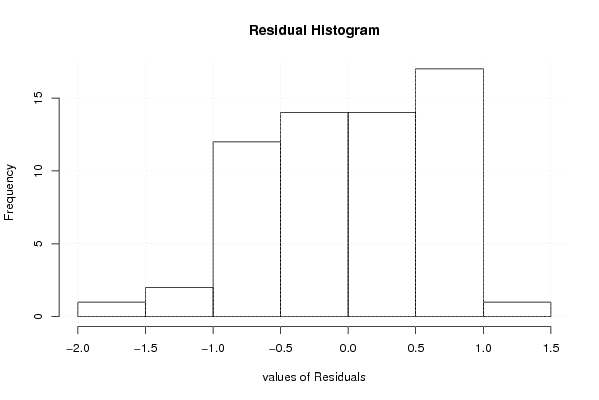
| Multiple Linear Regression - Residual Statistics | |
| Residual Standard Deviation | 0.671486566251615 |
| Sum Squared Residuals | 21.6429220155064 |
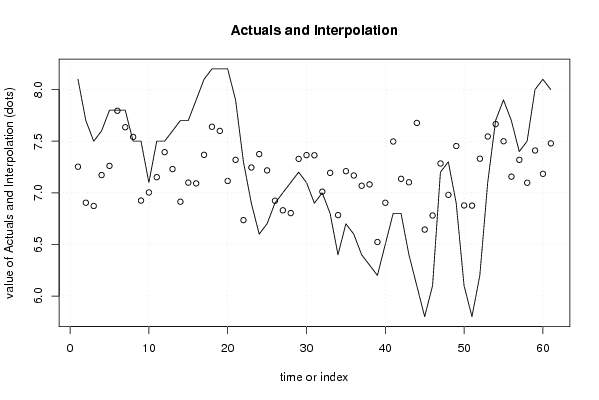
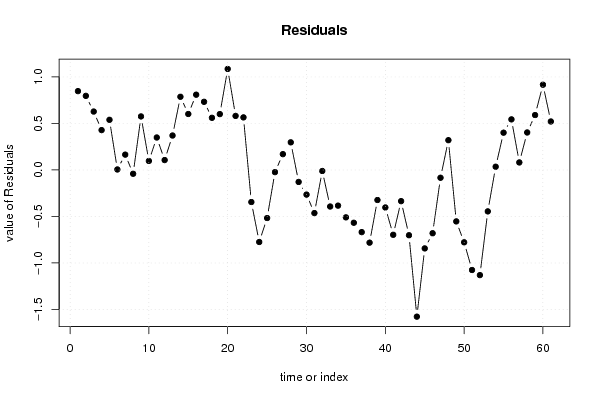
| Multiple Linear Regression - Actuals, Interpolation, and Residuals | |||
| Time or Index | Actuals | Interpolation Forecast | Residuals Prediction Error |
| 1 | 8.1 | 7.25261996721003 | 0.847380032789968 |
| 2 | 7.7 | 6.90379055783358 | 0.796209442166424 |
| 3 | 7.5 | 6.87232985907716 | 0.627670140922835 |
| 4 | 7.6 | 7.17186131240699 | 0.428138687593012 |
| 5 | 7.8 | 7.26098160596819 | 0.539018394031807 |
| 6 | 7.8 | 7.7948038021559 | 0.00519619784410598 |
| 7 | 7.8 | 7.63527234882607 | 0.164727651173929 |
| 8 | 7.5 | 7.54118074871564 | -0.0411807487156427 |
| 9 | 7.5 | 6.92481667642961 | 0.575183323570387 |
| 10 | 7.1 | 7.00350006167477 | 0.0964999383252329 |
| 11 | 7.5 | 7.15137167350073 | 0.348628326499271 |
| 12 | 7.5 | 7.39393464183514 | 0.106065358164858 |
| 13 | 7.6 | 7.22998906585601 | 0.370010934143988 |
| 14 | 7.7 | 6.91348951555673 | 0.786510484443275 |
| 15 | 7.7 | 7.09863887261731 | 0.601361127382688 |
| 16 | 7.9 | 7.09103666471408 | 0.808963335285923 |
| 17 | 8.1 | 7.36767014092284 | 0.732329859077163 |
| 18 | 8.2 | 7.63962047858551 | 0.560379521414493 |
| 19 | 8.2 | 7.59970950384119 | 0.600290496158809 |
| 20 | 8.2 | 7.11442660889708 | 1.08557339110292 |
| 21 | 7.9 | 7.31924095717101 | 0.580759042828986 |
| 22 | 7.3 | 6.7351622313343 | 0.564837768665695 |
| 23 | 6.9 | 7.2451282648245 | -0.345128264824504 |
| 24 | 6.6 | 7.37453672638884 | -0.774536726388844 |
| 25 | 6.7 | 7.21705712222515 | -0.517057122225146 |
| 26 | 6.9 | 6.92318847327987 | -0.0231884732798745 |
| 27 | 7 | 6.83030104227685 | 0.169698957723149 |
| 28 | 7.1 | 6.80330091892732 | 0.296699081072682 |
| 29 | 7.2 | 7.32887431003024 | -0.128874310030239 |
| 30 | 7.1 | 7.36481667642961 | -0.264816676429613 |
| 31 | 6.9 | 7.3637015325779 | -0.463701532577892 |
| 32 | 7 | 7.01097105985015 | -0.0109710598501535 |
| 33 | 6.8 | 7.19315450677007 | -0.393154506770074 |
| 34 | 6.4 | 6.78365701995005 | -0.383657019950051 |
| 35 | 6.7 | 7.20956541983962 | -0.509565419839624 |
| 36 | 6.6 | 7.16762562829499 | -0.567625628294995 |
| 37 | 6.4 | 7.06833977047019 | -0.668339770470192 |
| 38 | 6.3 | 7.08160478275798 | -0.781604782757979 |
| 39 | 6.2 | 6.52316738104379 | -0.323167381043793 |
| 40 | 6.5 | 6.90352348206653 | -0.403523482066526 |
| 41 | 6.8 | 7.49698957723149 | -0.696989577231493 |
| 42 | 6.8 | 7.13527467698175 | -0.335274676981749 |
| 43 | 6.4 | 7.10182967405286 | -0.701829674052864 |
| 44 | 6.1 | 7.67696615683973 | -1.57696615683973 |
| 45 | 5.8 | 6.64354690245829 | -0.843546902458286 |
| 46 | 6.1 | 6.78042403404233 | -0.680424034042335 |
| 47 | 7.2 | 7.2839240957171 | -0.0839240957171013 |
| 48 | 7.3 | 6.98011244564744 | 0.319887554352557 |
| 49 | 6.9 | 7.45306509348844 | -0.553065093488443 |
| 50 | 6.1 | 6.87792667057185 | -0.777926670571846 |
| 51 | 5.8 | 6.87556284498488 | -1.07556284498488 |
| 52 | 6.2 | 7.33027762188509 | -1.13027762188509 |
| 53 | 7.1 | 7.54548436584724 | -0.445484365847238 |
| 54 | 7.7 | 7.66548436584724 | 0.0345156341527624 |
| 55 | 7.9 | 7.49948694070198 | 0.400513059298018 |
| 56 | 7.7 | 7.15645542569739 | 0.543544574302608 |
| 57 | 7.4 | 7.31924095717101 | 0.0807590428289866 |
| 58 | 7.5 | 7.09725665299854 | 0.402743347001458 |
| 59 | 8 | 7.41001054611804 | 0.589989453881958 |
| 60 | 8.1 | 7.18379055783358 | 0.916209442166424 |
| 61 | 8 | 7.47892898075017 | 0.521071019249825 |
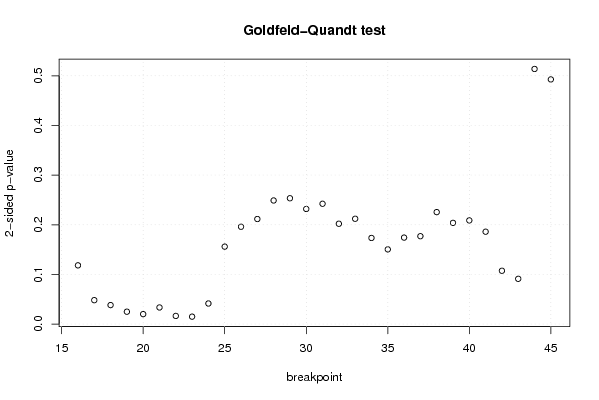
| Goldfeld-Quandt test for Heteroskedasticity | |||
| p-values | Alternative Hypothesis | ||
| breakpoint index | greater | 2-sided | less |
| 16 | 0.0591394414005024 | 0.118278882801005 | 0.940860558599498 |
| 17 | 0.0240875655033081 | 0.0481751310066162 | 0.975912434496692 |
| 18 | 0.0191193558498127 | 0.0382387116996254 | 0.980880644150187 |
| 19 | 0.0124773258092974 | 0.0249546516185948 | 0.987522674190703 |
| 20 | 0.0100210132195465 | 0.0200420264390930 | 0.989978986780454 |
| 21 | 0.0167358843605584 | 0.0334717687211168 | 0.983264115639442 |
| 22 | 0.00821571314144245 | 0.0164314262828849 | 0.991784286858558 |
| 23 | 0.00748459527841556 | 0.0149691905568311 | 0.992515404721585 |
| 24 | 0.0207217802391430 | 0.0414435604782861 | 0.979278219760857 |
| 25 | 0.0779731433137553 | 0.155946286627511 | 0.922026856686245 |
| 26 | 0.0979998927328926 | 0.195999785465785 | 0.902000107267107 |
| 27 | 0.105767416657562 | 0.211534833315124 | 0.894232583342438 |
| 28 | 0.124432410375279 | 0.248864820750559 | 0.87556758962472 |
| 29 | 0.126675692349951 | 0.253351384699902 | 0.873324307650049 |
| 30 | 0.115908474334584 | 0.231816948669167 | 0.884091525665416 |
| 31 | 0.121137073832096 | 0.242274147664191 | 0.878862926167904 |
| 32 | 0.101009505109382 | 0.202019010218765 | 0.898990494890618 |
| 33 | 0.106029065190479 | 0.212058130380958 | 0.893970934809521 |
| 34 | 0.0867130601297637 | 0.173426120259527 | 0.913286939870236 |
| 35 | 0.0752247549838616 | 0.150449509967723 | 0.924775245016138 |
| 36 | 0.0870795677156309 | 0.174159135431262 | 0.912920432284369 |
| 37 | 0.0884621083808797 | 0.176924216761759 | 0.91153789161912 |
| 38 | 0.112724352160978 | 0.225448704321955 | 0.887275647839022 |
| 39 | 0.101906720200415 | 0.203813440400829 | 0.898093279799585 |
| 40 | 0.104381930921923 | 0.208763861843847 | 0.895618069078077 |
| 41 | 0.0929939903021904 | 0.185987980604381 | 0.90700600969781 |
| 42 | 0.0536741971203214 | 0.107348394240643 | 0.946325802879679 |
| 43 | 0.0455758288085948 | 0.0911516576171896 | 0.954424171191405 |
| 44 | 0.74315714778325 | 0.5136857044335 | 0.25684285221675 |
| 45 | 0.753700561600871 | 0.492598876798257 | 0.246299438399129 |
| Meta Analysis of Goldfeld-Quandt test for Heteroskedasticity | |||
| Description | # significant tests | % significant tests | OK/NOK |
| 1% type I error level | 0 | 0 | OK |
| 5% type I error level | 8 | 0.266666666666667 | NOK |
| 10% type I error level | 9 | 0.3 | NOK |