| Multiple Linear Regression - Estimated Regression Equation |
| Y[t] = + 7.99291666666666 -1.16458333333333X[t] + 0.519999999999995M1[t] + 0.48M2[t] + 0.26M3[t] -0.0400000000000002M4[t] -0.280000000000000M5[t] -0.36M6[t] + 0.4M7[t] + 0.5M8[t] + 0.36M9[t] + 0.0599999999999997M10[t] -0.140000000000000M11[t] + e[t] |
| Multiple Linear Regression - Ordinary Least Squares | |||||
| Variable | Parameter | S.D. | T-STAT H0: parameter = 0 | 2-tail p-value | 1-tail p-value |
| (Intercept) | 7.99291666666666 | 0.248048 | 32.2233 | 0 | 0 |
| X | -1.16458333333333 | 0.177177 | -6.573 | 0 | 0 |
| M1 | 0.519999999999995 | 0.347195 | 1.4977 | 0.140893 | 0.070447 |
| M2 | 0.48 | 0.347195 | 1.3825 | 0.17335 | 0.086675 |
| M3 | 0.26 | 0.347195 | 0.7489 | 0.457674 | 0.228837 |
| M4 | -0.0400000000000002 | 0.347195 | -0.1152 | 0.90877 | 0.454385 |
| M5 | -0.280000000000000 | 0.347195 | -0.8065 | 0.424038 | 0.212019 |
| M6 | -0.36 | 0.347195 | -1.0369 | 0.305097 | 0.152548 |
| M7 | 0.4 | 0.347195 | 1.1521 | 0.25511 | 0.127555 |
| M8 | 0.5 | 0.347195 | 1.4401 | 0.156464 | 0.078232 |
| M9 | 0.36 | 0.347195 | 1.0369 | 0.305097 | 0.152548 |
| M10 | 0.0599999999999997 | 0.347195 | 0.1728 | 0.86354 | 0.43177 |
| M11 | -0.140000000000000 | 0.347195 | -0.4032 | 0.688606 | 0.344303 |
| Multiple Linear Regression - Regression Statistics | |
| Multiple R | 0.751988834719333 |
| R-squared | 0.56548720754254 |
| Adjusted R-squared | 0.454547771170422 |
| F-TEST (value) | 5.09726050568492 |
| F-TEST (DF numerator) | 12 |
| F-TEST (DF denominator) | 47 |
| p-value | 2.29121731929460e-05 |
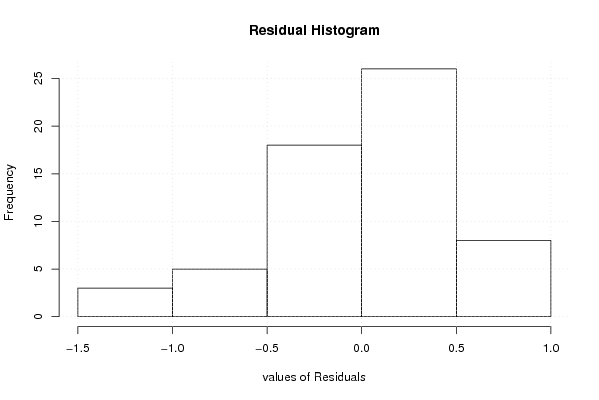
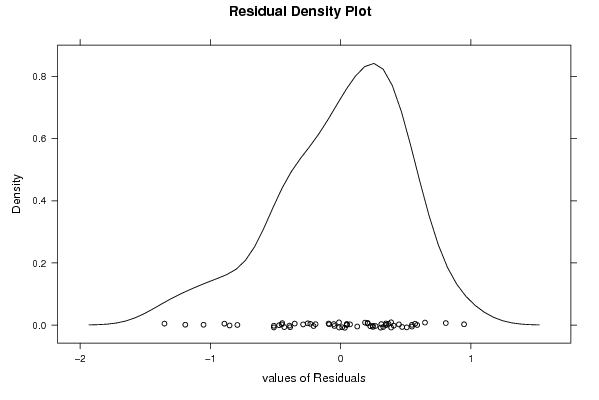
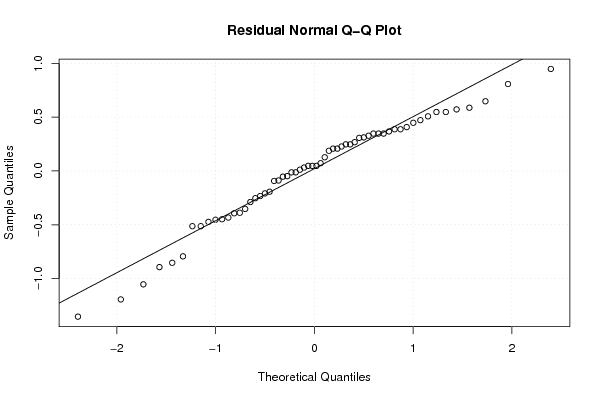
| Multiple Linear Regression - Residual Statistics | |
| Residual Standard Deviation | 0.54896340096844 |
| Sum Squared Residuals | 14.1639583333333 |
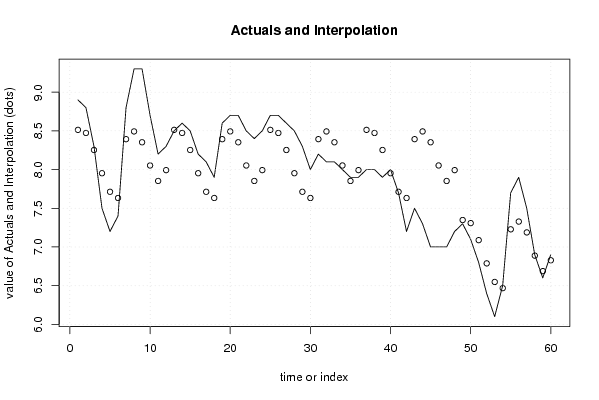
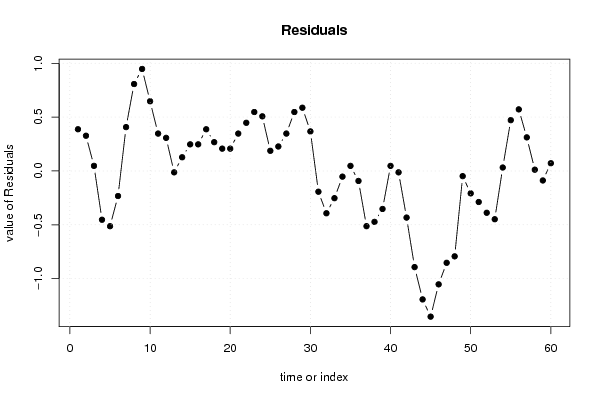
| Multiple Linear Regression - Actuals, Interpolation, and Residuals | |||
| Time or Index | Actuals | Interpolation Forecast | Residuals Prediction Error |
| 1 | 8.9 | 8.51291666666669 | 0.387083333333313 |
| 2 | 8.8 | 8.47291666666666 | 0.327083333333336 |
| 3 | 8.3 | 8.25291666666667 | 0.0470833333333337 |
| 4 | 7.5 | 7.95291666666667 | -0.452916666666666 |
| 5 | 7.2 | 7.71291666666667 | -0.512916666666667 |
| 6 | 7.4 | 7.63291666666667 | -0.232916666666666 |
| 7 | 8.8 | 8.39291666666667 | 0.407083333333334 |
| 8 | 9.3 | 8.49291666666667 | 0.807083333333335 |
| 9 | 9.3 | 8.35291666666667 | 0.947083333333334 |
| 10 | 8.7 | 8.05291666666667 | 0.647083333333333 |
| 11 | 8.2 | 7.85291666666667 | 0.347083333333333 |
| 12 | 8.3 | 7.99291666666667 | 0.307083333333334 |
| 13 | 8.5 | 8.51291666666666 | -0.0129166666666613 |
| 14 | 8.6 | 8.47291666666667 | 0.127083333333333 |
| 15 | 8.5 | 8.25291666666667 | 0.247083333333333 |
| 16 | 8.2 | 7.95291666666667 | 0.247083333333333 |
| 17 | 8.1 | 7.71291666666667 | 0.387083333333333 |
| 18 | 7.9 | 7.63291666666667 | 0.267083333333334 |
| 19 | 8.6 | 8.39291666666667 | 0.207083333333333 |
| 20 | 8.7 | 8.49291666666667 | 0.207083333333333 |
| 21 | 8.7 | 8.35291666666667 | 0.347083333333333 |
| 22 | 8.5 | 8.05291666666667 | 0.447083333333333 |
| 23 | 8.4 | 7.85291666666667 | 0.547083333333334 |
| 24 | 8.5 | 7.99291666666667 | 0.507083333333333 |
| 25 | 8.7 | 8.51291666666666 | 0.187083333333338 |
| 26 | 8.7 | 8.47291666666667 | 0.227083333333333 |
| 27 | 8.6 | 8.25291666666667 | 0.347083333333333 |
| 28 | 8.5 | 7.95291666666667 | 0.547083333333334 |
| 29 | 8.3 | 7.71291666666667 | 0.587083333333334 |
| 30 | 8 | 7.63291666666667 | 0.367083333333333 |
| 31 | 8.2 | 8.39291666666667 | -0.192916666666667 |
| 32 | 8.1 | 8.49291666666667 | -0.392916666666667 |
| 33 | 8.1 | 8.35291666666667 | -0.252916666666667 |
| 34 | 8 | 8.05291666666667 | -0.0529166666666665 |
| 35 | 7.9 | 7.85291666666667 | 0.0470833333333337 |
| 36 | 7.9 | 7.99291666666667 | -0.0929166666666665 |
| 37 | 8 | 8.51291666666666 | -0.512916666666661 |
| 38 | 8 | 8.47291666666667 | -0.472916666666667 |
| 39 | 7.9 | 8.25291666666667 | -0.352916666666667 |
| 40 | 8 | 7.95291666666667 | 0.0470833333333335 |
| 41 | 7.7 | 7.71291666666667 | -0.0129166666666668 |
| 42 | 7.2 | 7.63291666666667 | -0.432916666666667 |
| 43 | 7.5 | 8.39291666666667 | -0.892916666666666 |
| 44 | 7.3 | 8.49291666666667 | -1.19291666666667 |
| 45 | 7 | 8.35291666666667 | -1.35291666666667 |
| 46 | 7 | 8.05291666666667 | -1.05291666666667 |
| 47 | 7 | 7.85291666666667 | -0.852916666666666 |
| 48 | 7.2 | 7.99291666666667 | -0.792916666666666 |
| 49 | 7.3 | 7.34833333333333 | -0.0483333333333285 |
| 50 | 7.1 | 7.30833333333333 | -0.208333333333334 |
| 51 | 6.8 | 7.08833333333333 | -0.288333333333334 |
| 52 | 6.4 | 6.78833333333333 | -0.388333333333333 |
| 53 | 6.1 | 6.54833333333333 | -0.448333333333335 |
| 54 | 6.5 | 6.46833333333333 | 0.0316666666666660 |
| 55 | 7.7 | 7.22833333333333 | 0.471666666666667 |
| 56 | 7.9 | 7.32833333333333 | 0.571666666666667 |
| 57 | 7.5 | 7.18833333333333 | 0.311666666666666 |
| 58 | 6.9 | 6.88833333333333 | 0.0116666666666667 |
| 59 | 6.6 | 6.68833333333333 | -0.0883333333333341 |
| 60 | 6.9 | 6.82833333333333 | 0.0716666666666664 |
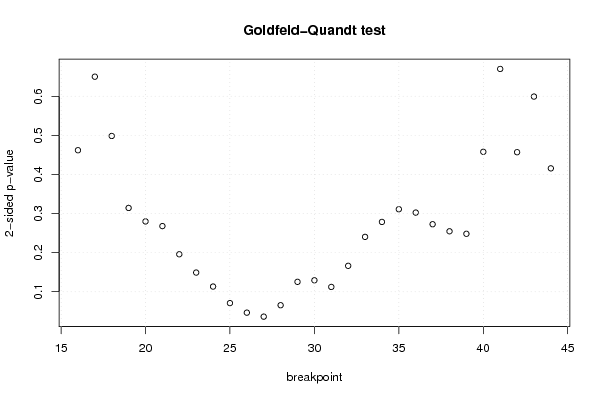
| Goldfeld-Quandt test for Heteroskedasticity | |||
| p-values | Alternative Hypothesis | ||
| breakpoint index | greater | 2-sided | less |
| 16 | 0.230988724045684 | 0.461977448091367 | 0.769011275954316 |
| 17 | 0.325025200894954 | 0.650050401789909 | 0.674974799105046 |
| 18 | 0.249225644861856 | 0.498451289723711 | 0.750774355138145 |
| 19 | 0.157171758108160 | 0.314343516216321 | 0.84282824189184 |
| 20 | 0.139926599970315 | 0.279853199940630 | 0.860073400029685 |
| 21 | 0.133932157631975 | 0.267864315263950 | 0.866067842368025 |
| 22 | 0.0979036391648705 | 0.195807278329741 | 0.902096360835130 |
| 23 | 0.0744963580812362 | 0.148992716162472 | 0.925503641918764 |
| 24 | 0.0566035062528214 | 0.113207012505643 | 0.943396493747179 |
| 25 | 0.0354671147063244 | 0.0709342294126488 | 0.964532885293676 |
| 26 | 0.0232124172399919 | 0.0464248344799838 | 0.976787582760008 |
| 27 | 0.0181100395082765 | 0.036220079016553 | 0.981889960491724 |
| 28 | 0.0327250022780279 | 0.0654500045560558 | 0.967274997721972 |
| 29 | 0.062646715297093 | 0.125293430594186 | 0.937353284702907 |
| 30 | 0.064622274252162 | 0.129244548504324 | 0.935377725747838 |
| 31 | 0.0561295674839927 | 0.112259134967985 | 0.943870432516007 |
| 32 | 0.0831251563230906 | 0.166250312646181 | 0.91687484367691 |
| 33 | 0.120140430505943 | 0.240280861011886 | 0.879859569494057 |
| 34 | 0.139250761343917 | 0.278501522687833 | 0.860749238656083 |
| 35 | 0.155506450434933 | 0.311012900869866 | 0.844493549565067 |
| 36 | 0.151214194342225 | 0.30242838868445 | 0.848785805657775 |
| 37 | 0.136302278470396 | 0.272604556940792 | 0.863697721529604 |
| 38 | 0.127289371558763 | 0.254578743117527 | 0.872710628441237 |
| 39 | 0.124084819112004 | 0.248169638224008 | 0.875915180887996 |
| 40 | 0.228946839015692 | 0.457893678031384 | 0.771053160984308 |
| 41 | 0.665067584503159 | 0.669864830993683 | 0.334932415496841 |
| 42 | 0.77155028031209 | 0.456899439375821 | 0.228449719687910 |
| 43 | 0.700391920659583 | 0.599216158680834 | 0.299608079340417 |
| 44 | 0.792206664233966 | 0.415586671532068 | 0.207793335766034 |
| Meta Analysis of Goldfeld-Quandt test for Heteroskedasticity | |||
| Description | # significant tests | % significant tests | OK/NOK |
| 1% type I error level | 0 | 0 | OK |
| 5% type I error level | 2 | 0.0689655172413793 | NOK |
| 10% type I error level | 4 | 0.137931034482759 | NOK |