| Multiple Linear Regression - Estimated Regression Equation |
| wrk[t] = + 95.9818034995944 -0.162336402129562indpr[t] -0.0647428561585364grn[t] + 0.178268715937659bw[t] + e[t] |
| Multiple Linear Regression - Ordinary Least Squares | |||||
| Variable | Parameter | S.D. | T-STAT H0: parameter = 0 | 2-tail p-value | 1-tail p-value |
| (Intercept) | 95.9818034995944 | 7.727485 | 12.4208 | 0 | 0 |
| indpr | -0.162336402129562 | 0.073663 | -2.2038 | 0.03167 | 0.015835 |
| grn | -0.0647428561585364 | 0.010282 | -6.2969 | 0 | 0 |
| bw | 0.178268715937659 | 0.044613 | 3.9959 | 0.00019 | 9.5e-05 |
| Multiple Linear Regression - Regression Statistics | |
| Multiple R | 0.746019135974758 |
| R-squared | 0.556544551240525 |
| Adjusted R-squared | 0.532788009342696 |
| F-TEST (value) | 23.4270018605437 |
| F-TEST (DF numerator) | 3 |
| F-TEST (DF denominator) | 56 |
| p-value | 5.91810156436168e-10 |
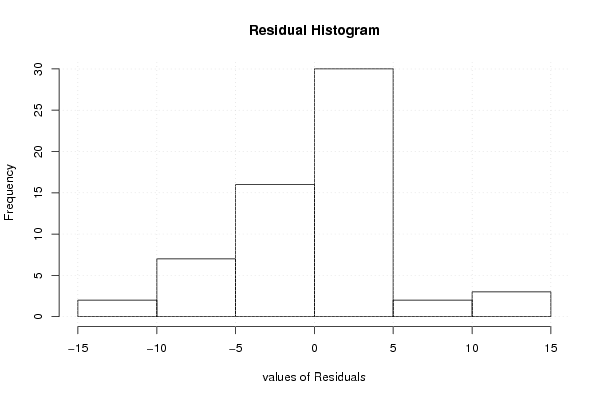
| Multiple Linear Regression - Residual Statistics | |
| Residual Standard Deviation | 5.030492271504 |
| Sum Squared Residuals | 1417.12773964504 |
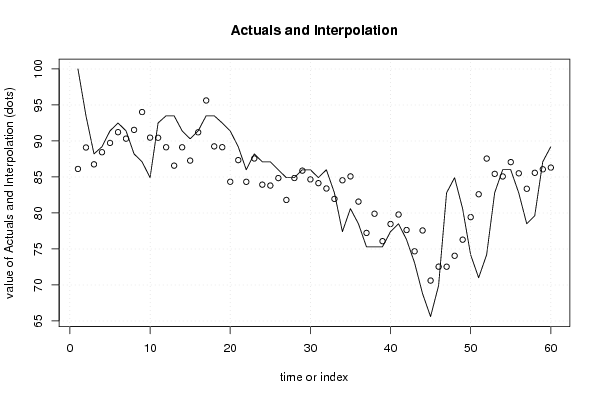
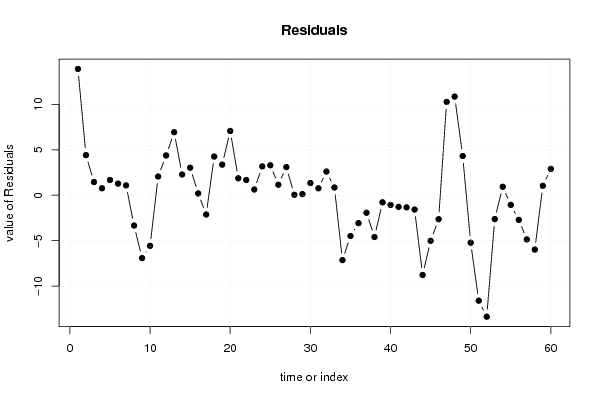
| Multiple Linear Regression - Actuals, Interpolation, and Residuals | |||
| Time or Index | Actuals | Interpolation Forecast | Residuals Prediction Error |
| 1 | 100 | 86.1120288927127 | 13.8879711072873 |
| 2 | 93.5 | 89.0911183326592 | 4.40888166734084 |
| 3 | 88.2 | 86.7519995473916 | 1.44800045260843 |
| 4 | 89.2 | 88.4358590871539 | 0.764140912846139 |
| 5 | 91.4 | 89.7238025916873 | 1.67619740831269 |
| 6 | 92.5 | 91.2212240052148 | 1.27877599478517 |
| 7 | 91.4 | 90.3191587271743 | 1.08084127282568 |
| 8 | 88.2 | 91.5350820126481 | -3.33508201264808 |
| 9 | 87.1 | 94.0136886638159 | -6.9136886638159 |
| 10 | 84.9 | 90.4645014073577 | -5.56450140735771 |
| 11 | 92.5 | 90.441531149827 | 2.05846885017309 |
| 12 | 93.5 | 89.1241030410283 | 4.37589695897173 |
| 13 | 93.5 | 86.5716379197688 | 6.92836208023122 |
| 14 | 91.4 | 89.1205697403595 | 2.27943025964049 |
| 15 | 90.3 | 87.2717046934977 | 3.02829530650228 |
| 16 | 91.4 | 91.2023476573016 | 0.197652342698408 |
| 17 | 93.5 | 95.6207926604181 | -2.12079266041815 |
| 18 | 93.5 | 89.2461636726742 | 4.25383632732585 |
| 19 | 92.5 | 89.1321698045765 | 3.36783019542345 |
| 20 | 91.4 | 84.3310363199165 | 7.0689636800835 |
| 21 | 89.2 | 87.3384350558266 | 1.86156494417345 |
| 22 | 86 | 84.324118810839 | 1.67588118916096 |
| 23 | 88.2 | 87.5694743150071 | 0.630525684992893 |
| 24 | 87.1 | 83.9300878424829 | 3.16991215751707 |
| 25 | 87.1 | 83.8059595470651 | 3.29404045293489 |
| 26 | 86 | 84.842069463563 | 1.15793053643705 |
| 27 | 84.9 | 81.8078062668963 | 3.09219373310375 |
| 28 | 84.9 | 84.8501779756871 | 0.0498220243129133 |
| 29 | 86 | 85.8767991132265 | 0.123200886773470 |
| 30 | 86 | 84.6607969568074 | 1.33920304319263 |
| 31 | 84.9 | 84.1392299290618 | 0.76077007093819 |
| 32 | 86 | 83.398289230732 | 2.60171076926797 |
| 33 | 82.8 | 81.9502194357878 | 0.849780564212186 |
| 34 | 77.4 | 84.53842139227 | -7.13842139226997 |
| 35 | 80.6 | 85.0810449701635 | -4.48104497016354 |
| 36 | 78.5 | 81.573285549895 | -3.07328554989509 |
| 37 | 75.3 | 77.2257695232606 | -1.92576952326064 |
| 38 | 75.3 | 79.8918788634754 | -4.59187886347536 |
| 39 | 75.3 | 76.0828404371352 | -0.78284043713523 |
| 40 | 77.4 | 78.4668282521588 | -1.06682825215880 |
| 41 | 78.5 | 79.7792175825139 | -1.27921758251387 |
| 42 | 76.3 | 77.6310820052119 | -1.33108200521189 |
| 43 | 73.1 | 74.676029570909 | -1.57602957090897 |
| 44 | 68.8 | 77.5679317721818 | -8.76793177218182 |
| 45 | 65.6 | 70.6108900205109 | -5.01089002051085 |
| 46 | 69.9 | 72.5411542234386 | -2.64115422343862 |
| 47 | 82.8 | 72.5341743489714 | 10.2658256510286 |
| 48 | 84.9 | 74.0539607457538 | 10.8460392542462 |
| 49 | 80.6 | 76.2888974911966 | 4.31110250880336 |
| 50 | 74.2 | 79.4199523730538 | -5.21995237305377 |
| 51 | 71 | 82.596866713149 | -11.5968667131490 |
| 52 | 74.2 | 87.5548046098363 | -13.3548046098363 |
| 53 | 82.8 | 85.4265116323251 | -2.62651163232511 |
| 54 | 86 | 85.0705158098905 | 0.929484190109497 |
| 55 | 86 | 87.0602579471919 | -1.06025794719188 |
| 56 | 82.8 | 85.50616539791 | -2.70616539790997 |
| 57 | 78.5 | 83.3580005193763 | -4.85800051937632 |
| 58 | 79.6 | 85.5759413173148 | -5.97594131731485 |
| 59 | 87.1 | 86.0635722157014 | 1.03642778429864 |
| 60 | 89.2 | 86.3000208450383 | 2.89997915496168 |
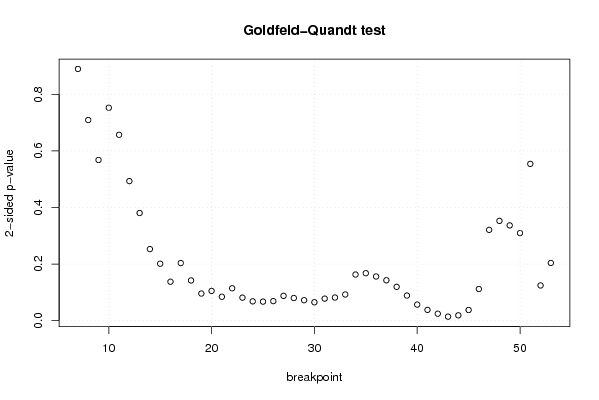
| Goldfeld-Quandt test for Heteroskedasticity | |||
| p-values | Alternative Hypothesis | ||
| breakpoint index | greater | 2-sided | less |
| 7 | 0.445034140966724 | 0.890068281933448 | 0.554965859033276 |
| 8 | 0.354710839918300 | 0.709421679836599 | 0.6452891600817 |
| 9 | 0.284078189082479 | 0.568156378164959 | 0.71592181091752 |
| 10 | 0.376360966678166 | 0.752721933356331 | 0.623639033321834 |
| 11 | 0.328608853344101 | 0.657217706688202 | 0.671391146655899 |
| 12 | 0.246729363695586 | 0.493458727391173 | 0.753270636304413 |
| 13 | 0.190222341557900 | 0.380444683115799 | 0.8097776584421 |
| 14 | 0.126493272715343 | 0.252986545430686 | 0.873506727284657 |
| 15 | 0.100643083350452 | 0.201286166700905 | 0.899356916649548 |
| 16 | 0.0688009544147705 | 0.137601908829541 | 0.93119904558523 |
| 17 | 0.101748562973606 | 0.203497125947212 | 0.898251437026394 |
| 18 | 0.0710283258188026 | 0.142056651637605 | 0.928971674181197 |
| 19 | 0.0478645456912701 | 0.0957290913825403 | 0.95213545430873 |
| 20 | 0.0525388571168908 | 0.105077714233782 | 0.94746114288311 |
| 21 | 0.042173498014149 | 0.084346996028298 | 0.95782650198585 |
| 22 | 0.0571533346517534 | 0.114306669303507 | 0.942846665348247 |
| 23 | 0.0405997815200276 | 0.0811995630400552 | 0.959400218479972 |
| 24 | 0.0340815463394675 | 0.068163092678935 | 0.965918453660533 |
| 25 | 0.0336097157270338 | 0.0672194314540676 | 0.966390284272966 |
| 26 | 0.0344598030760787 | 0.0689196061521574 | 0.965540196923921 |
| 27 | 0.0438072548104909 | 0.0876145096209818 | 0.956192745189509 |
| 28 | 0.0399457521194428 | 0.0798915042388857 | 0.960054247880557 |
| 29 | 0.0360810004259919 | 0.0721620008519838 | 0.963918999574008 |
| 30 | 0.0324759598393836 | 0.0649519196787671 | 0.967524040160616 |
| 31 | 0.0388959203377767 | 0.0777918406755534 | 0.961104079662223 |
| 32 | 0.0408203771738757 | 0.0816407543477513 | 0.959179622826124 |
| 33 | 0.0462178757137406 | 0.0924357514274812 | 0.95378212428626 |
| 34 | 0.0814773468241856 | 0.162954693648371 | 0.918522653175814 |
| 35 | 0.083841206929776 | 0.167682413859552 | 0.916158793070224 |
| 36 | 0.078001522840655 | 0.15600304568131 | 0.921998477159345 |
| 37 | 0.0713552107244577 | 0.142710421448915 | 0.928644789275542 |
| 38 | 0.059708769655306 | 0.119417539310612 | 0.940291230344694 |
| 39 | 0.0443210044077466 | 0.0886420088154933 | 0.955678995592253 |
| 40 | 0.0283178126698651 | 0.0566356253397302 | 0.971682187330135 |
| 41 | 0.0190037641990364 | 0.0380075283980728 | 0.980996235800964 |
| 42 | 0.0122120211649901 | 0.0244240423299803 | 0.98778797883501 |
| 43 | 0.00700308502731677 | 0.0140061700546335 | 0.992996914972683 |
| 44 | 0.0093548415661628 | 0.0187096831323256 | 0.990645158433837 |
| 45 | 0.0187740181364644 | 0.0375480362729287 | 0.981225981863536 |
| 46 | 0.0558834455520716 | 0.111766891104143 | 0.944116554447928 |
| 47 | 0.160503354554455 | 0.321006709108909 | 0.839496645445545 |
| 48 | 0.176360780890911 | 0.352721561781823 | 0.823639219109089 |
| 49 | 0.168360939992799 | 0.336721879985598 | 0.831639060007201 |
| 50 | 0.154786505559852 | 0.309573011119704 | 0.845213494440148 |
| 51 | 0.277203406939161 | 0.554406813878321 | 0.722796593060839 |
| 52 | 0.937814336854573 | 0.124371326290854 | 0.0621856631454272 |
| 53 | 0.898051548055673 | 0.203896903888654 | 0.101948451944327 |
| Meta Analysis of Goldfeld-Quandt test for Heteroskedasticity | |||
| Description | # significant tests | % significant tests | OK/NOK |
| 1% type I error level | 0 | 0 | OK |
| 5% type I error level | 5 | 0.106382978723404 | NOK |
| 10% type I error level | 20 | 0.425531914893617 | NOK |