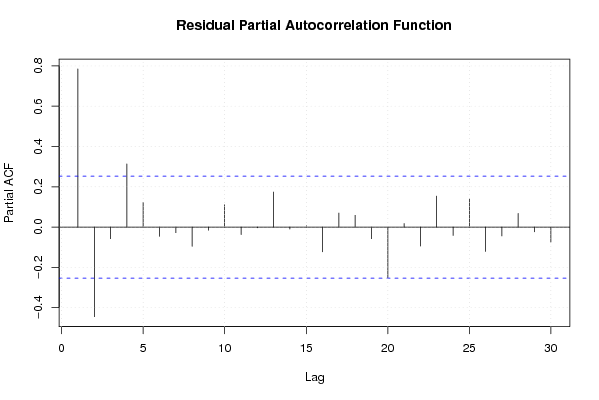
| Multiple Linear Regression - Estimated Regression Equation |
| WRKL(index)[t] = + 92.199660809865 + 0.167067318566415IND[t] -0.0875444282137551GRON[t] -4.59226868346676M1[t] -9.04060415156694M2[t] -10.7862675637739M3[t] -8.53221783711622M4[t] -5.09549250905359M5[t] -4.49506788834226M6[t] -6.2052324845473M7[t] -6.33400974837707M8[t] -8.07746333962857M9[t] -9.49496357315392M10[t] + 1.88043599877322M11[t] + e[t] |
| Multiple Linear Regression - Ordinary Least Squares | |||||
| Variable | Parameter | S.D. | T-STAT H0: parameter = 0 | 2-tail p-value | 1-tail p-value |
| (Intercept) | 92.199660809865 | 12.90404 | 7.145 | 0 | 0 |
| IND | 0.167067318566415 | 0.146367 | 1.1414 | 0.2596 | 0.1298 |
| GRON | -0.0875444282137551 | 0.01374 | -6.3715 | 0 | 0 |
| M1 | -4.59226868346676 | 4.335642 | -1.0592 | 0.295043 | 0.147522 |
| M2 | -9.04060415156694 | 4.408333 | -2.0508 | 0.046008 | 0.023004 |
| M3 | -10.7862675637739 | 3.933809 | -2.7419 | 0.008672 | 0.004336 |
| M4 | -8.53221783711622 | 3.573799 | -2.3874 | 0.021132 | 0.010566 |
| M5 | -5.09549250905359 | 3.562043 | -1.4305 | 0.159333 | 0.079666 |
| M6 | -4.49506788834226 | 3.590704 | -1.2519 | 0.216948 | 0.108474 |
| M7 | -6.2052324845473 | 4.046778 | -1.5334 | 0.132033 | 0.066016 |
| M8 | -6.33400974837707 | 3.618916 | -1.7503 | 0.086743 | 0.043371 |
| M9 | -8.07746333962857 | 3.563522 | -2.2667 | 0.028155 | 0.014077 |
| M10 | -9.49496357315392 | 4.070397 | -2.3327 | 0.024094 | 0.012047 |
| M11 | 1.88043599877322 | 3.774684 | 0.4982 | 0.620738 | 0.310369 |
| Multiple Linear Regression - Regression Statistics | |
| Multiple R | 0.758914349095157 |
| R-squared | 0.575950989262526 |
| Adjusted R-squared | 0.456111051445414 |
| F-TEST (value) | 4.80600207037395 |
| F-TEST (DF numerator) | 13 |
| F-TEST (DF denominator) | 46 |
| p-value | 3.39822078809782e-05 |
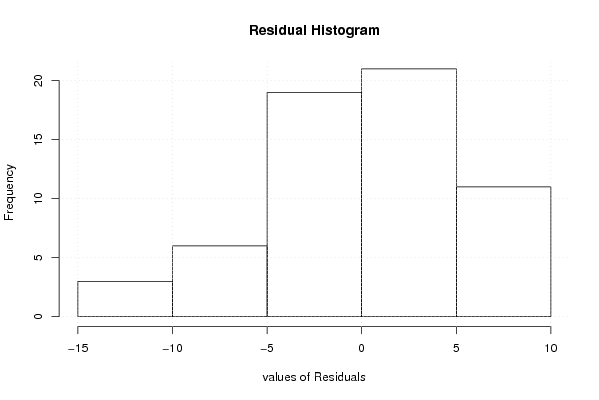
| Multiple Linear Regression - Residual Statistics | |
| Residual Standard Deviation | 5.42760974112452 |
| Sum Squared Residuals | 1355.11158508969 |
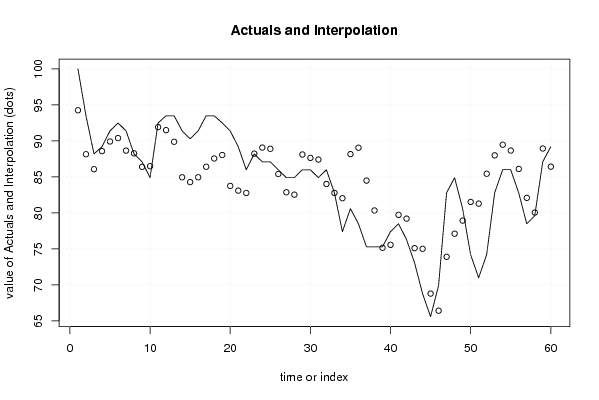
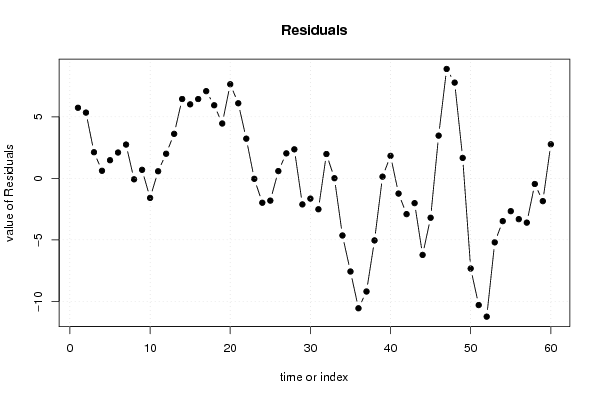
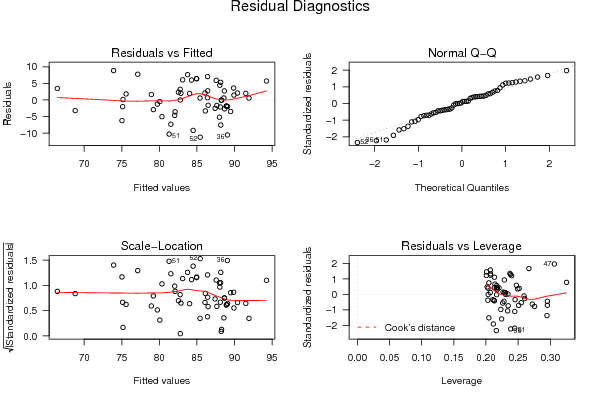
| Multiple Linear Regression - Actuals, Interpolation, and Residuals | |||
| Time or Index | Actuals | Interpolation Forecast | Residuals Prediction Error |
| 1 | 100 | 94.264727696937 | 5.73527230306293 |
| 2 | 93.5 | 88.1572666081836 | 5.34273339181641 |
| 3 | 88.2 | 86.0777455541471 | 2.12225444585289 |
| 4 | 89.2 | 88.5866147740625 | 0.613385225937554 |
| 5 | 91.4 | 89.9258979330944 | 1.47410206690563 |
| 6 | 92.5 | 90.4020867979084 | 2.09791320209159 |
| 7 | 91.4 | 88.6563504398112 | 2.74364956018878 |
| 8 | 88.2 | 88.2801808132763 | -0.080180813276266 |
| 9 | 87.1 | 86.4080940363658 | 0.691905963634222 |
| 10 | 84.9 | 86.492179869411 | -1.59217986941096 |
| 11 | 92.5 | 91.925390230399 | 0.574609769600989 |
| 12 | 93.5 | 91.5020351791292 | 1.99796482087082 |
| 13 | 93.5 | 89.8859712275029 | 3.61402877249707 |
| 14 | 91.4 | 84.9534175308635 | 6.44658246913653 |
| 15 | 90.3 | 84.2875514543526 | 6.01244854564736 |
| 16 | 91.4 | 84.9566603695102 | 6.44333963048978 |
| 17 | 93.5 | 86.4150893664195 | 7.08491063358052 |
| 18 | 93.5 | 87.562161713335 | 5.93783828666502 |
| 19 | 92.5 | 88.0444512616289 | 4.45554873837114 |
| 20 | 91.4 | 83.7534702184907 | 7.64652978150933 |
| 21 | 89.2 | 83.10055937416 | 6.09944062583996 |
| 22 | 86 | 82.774681036645 | 3.22531896335501 |
| 23 | 88.2 | 88.2386906535105 | -0.0386906535104934 |
| 24 | 87.1 | 89.0823233499818 | -1.98232334998178 |
| 25 | 87.1 | 88.9101480565739 | -1.81014805657388 |
| 26 | 86 | 85.4111646844611 | 0.588835315538858 |
| 27 | 84.9 | 82.8714611833448 | 2.02853881665519 |
| 28 | 84.9 | 82.5428406121689 | 2.3571593878311 |
| 29 | 86 | 88.1185816084883 | -2.11858160848829 |
| 30 | 86 | 87.6478248386732 | -1.64782483867319 |
| 31 | 84.9 | 87.4139236320123 | -2.51392363201233 |
| 32 | 86 | 84.0253138556103 | 1.97468614438972 |
| 33 | 82.8 | 82.7902123553072 | 0.00978764469281779 |
| 34 | 77.4 | 82.0447151696747 | -4.64471516967472 |
| 35 | 80.6 | 88.1729832918753 | -7.57298329187535 |
| 36 | 78.5 | 89.0613981027171 | -10.5613981027171 |
| 37 | 75.3 | 84.4988495260384 | -9.19884952603839 |
| 38 | 75.3 | 80.3475418744325 | -5.04754187443252 |
| 39 | 75.3 | 75.16434288539 | 0.135657114610073 |
| 40 | 77.4 | 75.5728383164334 | 1.82716168356657 |
| 41 | 78.5 | 79.7378963717703 | -1.23789637177028 |
| 42 | 76.3 | 79.2096615246586 | -2.90966152465861 |
| 43 | 73.1 | 75.1160897661586 | -2.0160897661586 |
| 44 | 68.8 | 75.0234498394057 | -6.22344983940574 |
| 45 | 65.6 | 68.8022170343213 | -3.20221703432133 |
| 46 | 69.9 | 66.4284627327389 | 3.47153726726116 |
| 47 | 82.8 | 73.910183881805 | 8.88981611819508 |
| 48 | 84.9 | 77.1206150896642 | 7.77938491033579 |
| 49 | 80.6 | 78.9403034929477 | 1.65969650705227 |
| 50 | 74.2 | 81.5306093020593 | -7.33060930205928 |
| 51 | 71 | 81.2988989227655 | -10.2988989227655 |
| 52 | 74.2 | 85.441045927825 | -11.241045927825 |
| 53 | 82.8 | 88.0025347202276 | -5.20253472022758 |
| 54 | 86 | 89.4782651254248 | -3.4782651254248 |
| 55 | 86 | 88.669184900389 | -2.66918490038898 |
| 56 | 82.8 | 86.117585273217 | -3.31758527321704 |
| 57 | 78.5 | 82.0989171998457 | -3.59891719984567 |
| 58 | 79.6 | 80.0599611915305 | -0.459961191530488 |
| 59 | 87.1 | 88.9527519424102 | -1.85275194241023 |
| 60 | 89.2 | 86.4336282785077 | 2.76637172149227 |
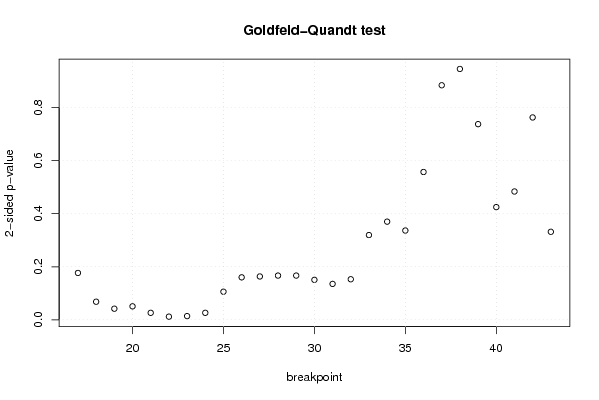
| Goldfeld-Quandt test for Heteroskedasticity | |||
| p-values | Alternative Hypothesis | ||
| breakpoint index | greater | 2-sided | less |
| 17 | 0.0883176598664987 | 0.176635319732997 | 0.911682340133501 |
| 18 | 0.0340663847442108 | 0.0681327694884216 | 0.96593361525579 |
| 19 | 0.0209341186630308 | 0.0418682373260616 | 0.97906588133697 |
| 20 | 0.0254084123877203 | 0.0508168247754406 | 0.97459158761228 |
| 21 | 0.0131617613510157 | 0.0263235227020314 | 0.986838238648984 |
| 22 | 0.00593521653886183 | 0.0118704330777237 | 0.994064783461138 |
| 23 | 0.00699761351781313 | 0.0139952270356263 | 0.993002386482187 |
| 24 | 0.0131529687229967 | 0.0263059374459933 | 0.986847031277003 |
| 25 | 0.0529747252026975 | 0.105949450405395 | 0.947025274797302 |
| 26 | 0.0800556310161845 | 0.160111262032369 | 0.919944368983816 |
| 27 | 0.0817110552106524 | 0.163422110421305 | 0.918288944789348 |
| 28 | 0.0833689959068938 | 0.166737991813788 | 0.916631004093106 |
| 29 | 0.0833782203538325 | 0.166756440707665 | 0.916621779646168 |
| 30 | 0.0753507483204308 | 0.150701496640862 | 0.924649251679569 |
| 31 | 0.0676932656245066 | 0.135386531249013 | 0.932306734375493 |
| 32 | 0.0764364184625458 | 0.152872836925092 | 0.923563581537454 |
| 33 | 0.159769175097530 | 0.319538350195060 | 0.84023082490247 |
| 34 | 0.185046913413765 | 0.370093826827530 | 0.814953086586235 |
| 35 | 0.168296610085901 | 0.336593220171802 | 0.831703389914099 |
| 36 | 0.27865035269739 | 0.55730070539478 | 0.72134964730261 |
| 37 | 0.557866885128863 | 0.884266229742274 | 0.442133114871137 |
| 38 | 0.472899221254867 | 0.945798442509733 | 0.527100778745133 |
| 39 | 0.631124463397178 | 0.737751073205645 | 0.368875536602822 |
| 40 | 0.787581787024453 | 0.424836425951094 | 0.212418212975547 |
| 41 | 0.75808804284423 | 0.483823914311541 | 0.241911957155771 |
| 42 | 0.618530338364854 | 0.762939323270292 | 0.381469661635146 |
| 43 | 0.834106460293649 | 0.331787079412702 | 0.165893539706351 |
| Meta Analysis of Goldfeld-Quandt test for Heteroskedasticity | |||
| Description | # significant tests | % significant tests | OK/NOK |
| 1% type I error level | 0 | 0 | OK |
| 5% type I error level | 5 | 0.185185185185185 | NOK |
| 10% type I error level | 7 | 0.259259259259259 | NOK |