| Univariate ARIMA Extrapolation Forecast | ||||||||
| time | Y[t] | F[t] | 95% LB | 95% UB | p-value (H0: Y[t] = F[t]) | P(F[t]>Y[t-1]) | P(F[t]>Y[t-s]) | P(F[t]>Y[69]) |
| 57 | 112.5 | - | - | - | - | - | - | - |
| 58 | 122.4 | - | - | - | - | - | - | - |
| 59 | 113.3 | - | - | - | - | - | - | - |
| 60 | 100 | - | - | - | - | - | - | - |
| 61 | 110.7 | - | - | - | - | - | - | - |
| 62 | 112.8 | - | - | - | - | - | - | - |
| 63 | 109.8 | - | - | - | - | - | - | - |
| 64 | 117.3 | - | - | - | - | - | - | - |
| 65 | 109.1 | - | - | - | - | - | - | - |
| 66 | 115.9 | - | - | - | - | - | - | - |
| 67 | 96 | - | - | - | - | - | - | - |
| 68 | 99.8 | - | - | - | - | - | - | - |
| 69 | 116.8 | - | - | - | - | - | - | - |
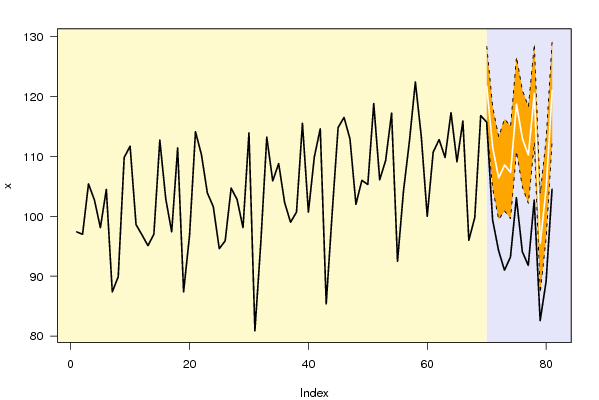
| 70 | 115.7 | 121.6435 | 114.954 | 128.333 | 0.0408 | 0.9221 | 0.4123 | 0.9221 |
| 71 | 99.4 | 111.4002 | 104.6014 | 118.1991 | 3e-04 | 0.1076 | 0.292 | 0.0598 |
| 72 | 94.3 | 106.3817 | 99.4714 | 113.2921 | 3e-04 | 0.9762 | 0.9649 | 0.0016 |
| 73 | 91 | 108.5615 | 100.888 | 116.235 | 0 | 0.9999 | 0.2925 | 0.0177 |
| 74 | 93.2 | 107.3216 | 99.6109 | 115.0324 | 2e-04 | 1 | 0.0819 | 0.008 |
| 75 | 103.1 | 118.6898 | 110.8112 | 126.5684 | 1e-04 | 1 | 0.9865 | 0.6809 |
| 76 | 94.1 | 112.9234 | 104.8518 | 120.995 | 0 | 0.9915 | 0.1439 | 0.1733 |
| 77 | 91.8 | 110.2245 | 102.1533 | 118.2958 | 0 | 1 | 0.6076 | 0.0552 |
| 78 | 102.7 | 120.4849 | 112.2726 | 128.6972 | 0 | 1 | 0.8631 | 0.8104 |
| 79 | 82.6 | 95.5277 | 87.2483 | 103.8072 | 0.0011 | 0.0448 | 0.4555 | 0 |
| 80 | 89.1 | 104.8219 | 96.5346 | 113.1093 | 1e-04 | 1 | 0.8825 | 0.0023 |
| 81 | 104.5 | 120.9564 | 112.5741 | 129.3387 | 1e-04 | 1 | 0.8344 | 0.8344 |
| Univariate ARIMA Extrapolation Forecast Performance | ||||||
| time | % S.E. | PE | MAPE | Sq.E | MSE | RMSE |
| 70 | 0.0281 | -0.0489 | 0 | 35.3253 | 0 | 0 |
| 71 | 0.0311 | -0.1077 | 0.0783 | 144.0055 | 89.6654 | 9.4692 |
| 72 | 0.0331 | -0.1136 | 0.0901 | 145.9683 | 108.433 | 10.4131 |
| 73 | 0.0361 | -0.1618 | 0.108 | 308.4071 | 158.4265 | 12.5868 |
| 74 | 0.0367 | -0.1316 | 0.1127 | 199.4204 | 166.6253 | 12.9083 |
| 75 | 0.0339 | -0.1313 | 0.1158 | 243.0404 | 179.3612 | 13.3926 |
| 76 | 0.0365 | -0.1667 | 0.1231 | 354.3195 | 204.3552 | 14.2953 |
| 77 | 0.0374 | -0.1672 | 0.1286 | 339.4635 | 221.2437 | 14.8743 |
| 78 | 0.0348 | -0.1476 | 0.1307 | 316.3024 | 231.8058 | 15.2252 |
| 79 | 0.0442 | -0.1353 | 0.1312 | 167.1266 | 225.3379 | 15.0113 |
| 80 | 0.0403 | -0.15 | 0.1329 | 247.1789 | 227.3234 | 15.0772 |
| 81 | 0.0354 | -0.1361 | 0.1331 | 270.8131 | 230.9476 | 15.197 |