| Multiple Linear Regression - Estimated Regression Equation |
| ChemischeNijverheid[t] = + 114.045891608392 -14.2594696969697Dummy_1_tijdenscrisis[t] -0.643036130536138Dummy_2_voorcrisis[t] + 3.70175990675989M1[t] + 1.19324592074591M2[t] + 1.30473193473193M3[t] + 4.23621794871794M4[t] -0.972296037296041M5[t] + 5.95918997668996M6[t] -0.629324009324017M7[t] -0.717837995338005M8[t] + 3.77364801864801M9[t] + 1.56513403263402M10[t] + 1.86522727272727M11[t] + 0.0685139860139864t + e[t] |
| Multiple Linear Regression - Ordinary Least Squares | |||||
| Variable | Parameter | S.D. | T-STAT H0: parameter = 0 | 2-tail p-value | 1-tail p-value |
| (Intercept) | 114.045891608392 | 2.967911 | 38.4263 | 0 | 0 |
| Dummy_1_tijdenscrisis | -14.2594696969697 | 3.839393 | -3.714 | 0.000561 | 0.00028 |
| Dummy_2_voorcrisis | -0.643036130536138 | 2.802759 | -0.2294 | 0.819575 | 0.409787 |
| M1 | 3.70175990675989 | 3.390255 | 1.0919 | 0.280696 | 0.140348 |
| M2 | 1.19324592074591 | 3.382025 | 0.3528 | 0.725871 | 0.362935 |
| M3 | 1.30473193473193 | 3.376365 | 0.3864 | 0.700999 | 0.350499 |
| M4 | 4.23621794871794 | 3.373288 | 1.2558 | 0.215665 | 0.107833 |
| M5 | -0.972296037296041 | 3.372802 | -0.2883 | 0.77446 | 0.38723 |
| M6 | 5.95918997668996 | 3.374908 | 1.7657 | 0.084225 | 0.042112 |
| M7 | -0.629324009324017 | 3.3796 | -0.1862 | 0.853115 | 0.426557 |
| M8 | -0.717837995338005 | 3.386869 | -0.2119 | 0.833105 | 0.416553 |
| M9 | 3.77364801864801 | 3.396697 | 1.111 | 0.27248 | 0.13624 |
| M10 | 1.56513403263402 | 3.409062 | 0.4591 | 0.648365 | 0.324183 |
| M11 | 1.86522727272727 | 3.384044 | 0.5512 | 0.584235 | 0.292117 |
| t | 0.0685139860139864 | 0.093506 | 0.7327 | 0.467529 | 0.233765 |
| Multiple Linear Regression - Regression Statistics | |
| Multiple R | 0.766919546586582 |
| R-squared | 0.588165590936568 |
| Adjusted R-squared | 0.460039330339056 |
| F-TEST (value) | 4.59051554453926 |
| F-TEST (DF numerator) | 14 |
| F-TEST (DF denominator) | 45 |
| p-value | 4.53898964412058e-05 |
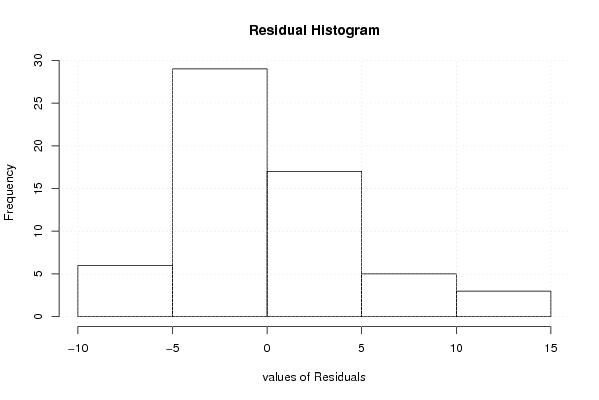
| Multiple Linear Regression - Residual Statistics | |
| Residual Standard Deviation | 5.30396995837526 |
| Sum Squared Residuals | 1265.94437937063 |
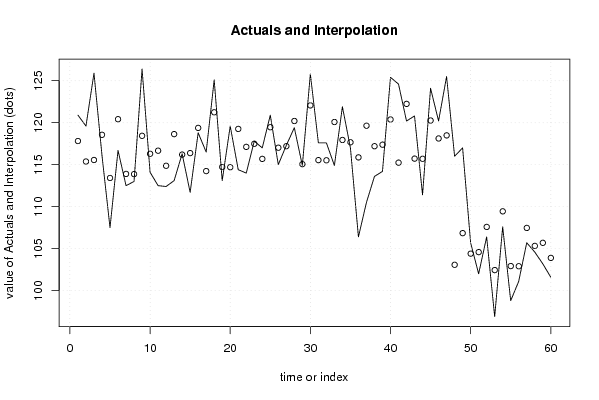
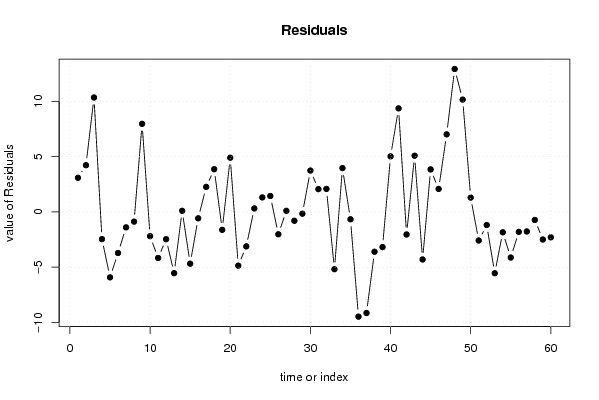
| Multiple Linear Regression - Actuals, Interpolation, and Residuals | |||
| Time or Index | Actuals | Interpolation Forecast | Residuals Prediction Error |
| 1 | 120.9 | 117.816165501166 | 3.08383449883446 |
| 2 | 119.6 | 115.376165501166 | 4.22383449883448 |
| 3 | 125.9 | 115.556165501165 | 10.3438344988345 |
| 4 | 116.1 | 118.556165501165 | -2.4561655011655 |
| 5 | 107.5 | 113.416165501165 | -5.9161655011655 |
| 6 | 116.7 | 120.416165501165 | -3.7161655011655 |
| 7 | 112.5 | 113.896165501165 | -1.39616550116549 |
| 8 | 113 | 113.876165501165 | -0.876165501165494 |
| 9 | 126.4 | 118.436165501165 | 7.96383449883452 |
| 10 | 114.1 | 116.296165501166 | -2.19616550116550 |
| 11 | 112.5 | 116.664772727273 | -4.16477272727273 |
| 12 | 112.4 | 114.868059440559 | -2.46805944055944 |
| 13 | 113.1 | 118.638333333333 | -5.53833333333334 |
| 14 | 116.3 | 116.198333333333 | 0.101666666666667 |
| 15 | 111.7 | 116.378333333333 | -4.67833333333333 |
| 16 | 118.8 | 119.378333333333 | -0.578333333333339 |
| 17 | 116.5 | 114.238333333333 | 2.26166666666666 |
| 18 | 125.1 | 121.238333333333 | 3.86166666666667 |
| 19 | 113.1 | 114.718333333333 | -1.61833333333334 |
| 20 | 119.6 | 114.698333333333 | 4.90166666666666 |
| 21 | 114.4 | 119.258333333333 | -4.85833333333333 |
| 22 | 114 | 117.118333333333 | -3.11833333333333 |
| 23 | 117.8 | 117.486940559441 | 0.313059440559436 |
| 24 | 117 | 115.690227272727 | 1.30977272727272 |
| 25 | 120.9 | 119.460501165501 | 1.43949883449885 |
| 26 | 115 | 117.020501165501 | -2.02050116550116 |
| 27 | 117.3 | 117.200501165501 | 0.099498834498827 |
| 28 | 119.4 | 120.200501165501 | -0.800501165501166 |
| 29 | 114.9 | 115.060501165501 | -0.160501165501166 |
| 30 | 125.8 | 122.060501165501 | 3.73949883449884 |
| 31 | 117.6 | 115.540501165501 | 2.05949883449883 |
| 32 | 117.6 | 115.520501165501 | 2.07949883449883 |
| 33 | 114.9 | 120.080501165501 | -5.18050116550117 |
| 34 | 121.9 | 117.940501165501 | 3.95949883449884 |
| 35 | 117 | 117.666072261072 | -0.66607226107226 |
| 36 | 106.4 | 115.869358974359 | -9.46935897435897 |
| 37 | 110.5 | 119.639632867133 | -9.13963286713286 |
| 38 | 113.6 | 117.199632867133 | -3.59963286713287 |
| 39 | 114.2 | 117.379632867133 | -3.17963286713287 |
| 40 | 125.4 | 120.379632867133 | 5.02036713286714 |
| 41 | 124.6 | 115.239632867133 | 9.36036713286713 |
| 42 | 120.2 | 122.239632867133 | -2.03963286713286 |
| 43 | 120.8 | 115.719632867133 | 5.08036713286713 |
| 44 | 111.4 | 115.699632867133 | -4.29963286713286 |
| 45 | 124.1 | 120.259632867133 | 3.84036713286713 |
| 46 | 120.2 | 118.119632867133 | 2.08036713286714 |
| 47 | 125.5 | 118.488240093240 | 7.0117599067599 |
| 48 | 116 | 103.075093240093 | 12.9249067599068 |
| 49 | 117 | 106.845367132867 | 10.1546328671329 |
| 50 | 105.7 | 104.405367132867 | 1.29463286713287 |
| 51 | 102 | 104.585367132867 | -2.58536713286713 |
| 52 | 106.4 | 107.585367132867 | -1.18536713286713 |
| 53 | 96.9 | 102.445367132867 | -5.54536713286713 |
| 54 | 107.6 | 109.445367132867 | -1.84536713286713 |
| 55 | 98.8 | 102.925367132867 | -4.12536713286713 |
| 56 | 101.1 | 102.905367132867 | -1.80536713286714 |
| 57 | 105.7 | 107.465367132867 | -1.76536713286713 |
| 58 | 104.6 | 105.325367132867 | -0.725367132867139 |
| 59 | 103.2 | 105.693974358974 | -2.49397435897436 |
| 60 | 101.6 | 103.897261072261 | -2.29726107226108 |
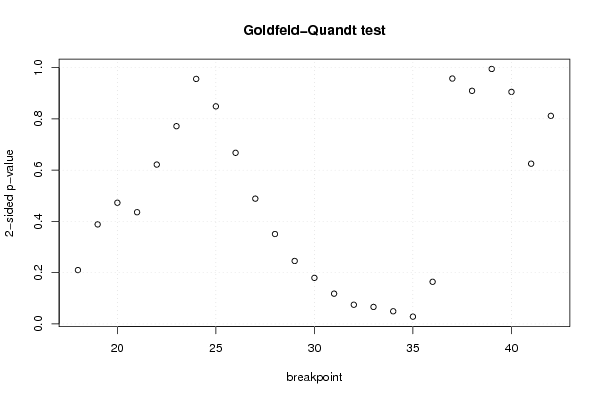
| Goldfeld-Quandt test for Heteroskedasticity | |||
| p-values | Alternative Hypothesis | ||
| breakpoint index | greater | 2-sided | less |
| 18 | 0.894969661594563 | 0.210060676810874 | 0.105030338405437 |
| 19 | 0.80587886051146 | 0.388242278977078 | 0.194121139488539 |
| 20 | 0.763635736408602 | 0.472728527182797 | 0.236364263591398 |
| 21 | 0.782103087358743 | 0.435793825282514 | 0.217896912641257 |
| 22 | 0.689183217644121 | 0.621633564711757 | 0.310816782355879 |
| 23 | 0.614276663233658 | 0.771446673532683 | 0.385723336766342 |
| 24 | 0.522066724468244 | 0.955866551063512 | 0.477933275531756 |
| 25 | 0.424404151703132 | 0.848808303406264 | 0.575595848296868 |
| 26 | 0.333762829127885 | 0.667525658255769 | 0.666237170872116 |
| 27 | 0.244357021684049 | 0.488714043368098 | 0.755642978315951 |
| 28 | 0.175318235426063 | 0.350636470852126 | 0.824681764573937 |
| 29 | 0.122758938440850 | 0.245517876881701 | 0.87724106155915 |
| 30 | 0.0898019499237692 | 0.179603899847538 | 0.91019805007623 |
| 31 | 0.0589675822827187 | 0.117935164565437 | 0.941032417717281 |
| 32 | 0.0373509704854906 | 0.0747019409709813 | 0.96264902951451 |
| 33 | 0.0330846715765257 | 0.0661693431530515 | 0.966915328423474 |
| 34 | 0.0246099302578340 | 0.0492198605156679 | 0.975390069742166 |
| 35 | 0.0141292110519984 | 0.0282584221039967 | 0.985870788948002 |
| 36 | 0.082135044142416 | 0.164270088284832 | 0.917864955857584 |
| 37 | 0.478664800687971 | 0.957329601375943 | 0.521335199312029 |
| 38 | 0.545320311901681 | 0.909359376196637 | 0.454679688098319 |
| 39 | 0.502600119686117 | 0.994799760627766 | 0.497399880313883 |
| 40 | 0.452668738090829 | 0.905337476181658 | 0.547331261909171 |
| 41 | 0.68744436992592 | 0.625111260148159 | 0.312555630074080 |
| 42 | 0.594110159647831 | 0.811779680704338 | 0.405889840352169 |
| Meta Analysis of Goldfeld-Quandt test for Heteroskedasticity | |||
| Description | # significant tests | % significant tests | OK/NOK |
| 1% type I error level | 0 | 0 | OK |
| 5% type I error level | 2 | 0.08 | NOK |
| 10% type I error level | 4 | 0.16 | NOK |