| Multiple Linear Regression - Estimated Regression Equation |
| WK<25j[t] = + 144.986686095178 -0.89516816235565ExpBe[t] + e[t] |
| Multiple Linear Regression - Ordinary Least Squares | |||||
| Variable | Parameter | S.D. | T-STAT H0: parameter = 0 | 2-tail p-value | 1-tail p-value |
| (Intercept) | 144.986686095178 | 19.355018 | 7.4909 | 0 | 0 |
| ExpBe | -0.89516816235565 | 1.163893 | -0.7691 | 0.444945 | 0.222473 |
| Multiple Linear Regression - Regression Statistics | |
| Multiple R | 0.100478759942464 |
| R-squared | 0.0100959811995754 |
| Adjusted R-squared | -0.00697132946939738 |
| F-TEST (value) | 0.591539076975329 |
| F-TEST (DF numerator) | 1 |
| F-TEST (DF denominator) | 58 |
| p-value | 0.444945412800618 |
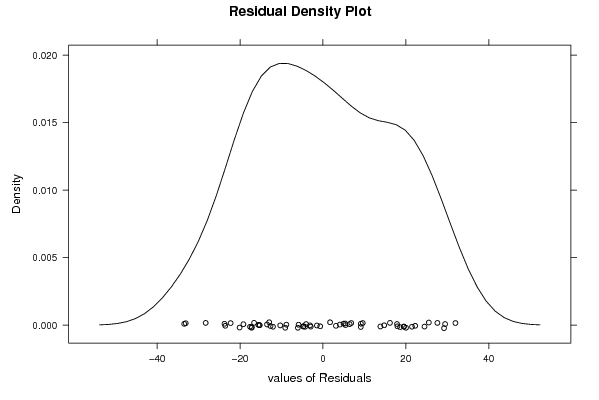
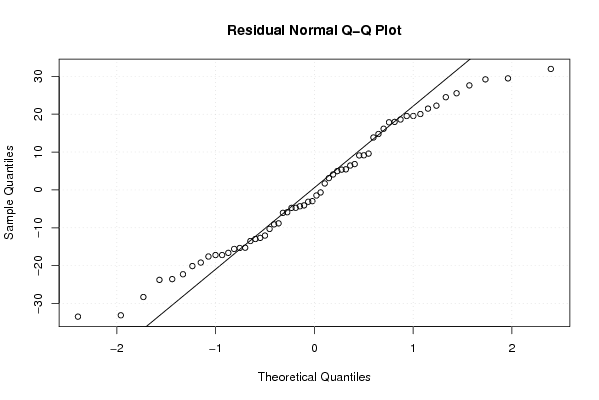
| Multiple Linear Regression - Residual Statistics | |
| Residual Standard Deviation | 17.3107196211353 |
| Sum Squared Residuals | 17380.3388004903 |
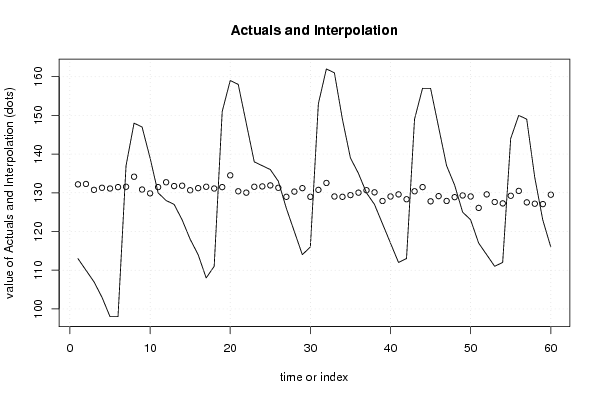
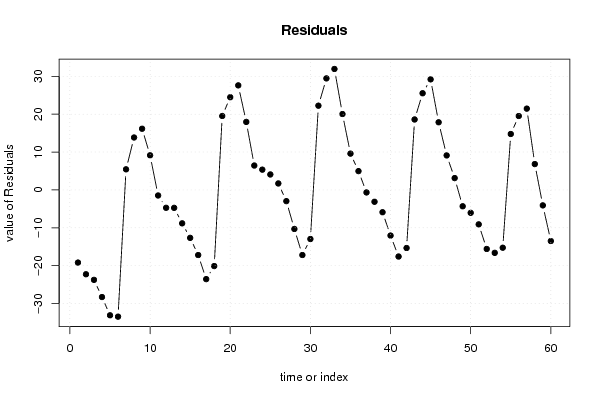
| Multiple Linear Regression - Actuals, Interpolation, and Residuals | |||
| Time or Index | Actuals | Interpolation Forecast | Residuals Prediction Error |
| 1 | 113 | 132.185781373492 | -19.1857813734922 |
| 2 | 110 | 132.275298189728 | -22.2752981897278 |
| 3 | 107 | 130.753512313723 | -23.7535123137232 |
| 4 | 103 | 131.290613211137 | -28.2906132111366 |
| 5 | 98 | 131.111579578665 | -33.1115795786655 |
| 6 | 98 | 131.469646843608 | -33.4696468436078 |
| 7 | 137 | 131.559163659843 | 5.44083634015667 |
| 8 | 148 | 134.155151330675 | 13.8448486693253 |
| 9 | 147 | 130.843029129959 | 16.1569708700412 |
| 10 | 139 | 129.858344151368 | 9.1416558486324 |
| 11 | 130 | 131.469646843608 | -1.46964684360776 |
| 12 | 128 | 132.722882270906 | -4.72288227090567 |
| 13 | 127 | 131.738197292314 | -4.73819729231446 |
| 14 | 123 | 131.82771410855 | -8.82771410855002 |
| 15 | 118 | 130.663995497488 | -12.6639954974877 |
| 16 | 114 | 131.201096394901 | -17.2010963949011 |
| 17 | 108 | 131.559163659843 | -23.5591636598433 |
| 18 | 111 | 131.111579578665 | -20.1115795786655 |
| 19 | 151 | 131.469646843608 | 19.5303531563922 |
| 20 | 159 | 134.513218595617 | 24.486781404383 |
| 21 | 158 | 130.395445048781 | 27.604554951219 |
| 22 | 148 | 130.037377783839 | 17.9626222161613 |
| 23 | 138 | 131.559163659843 | 6.44083634015667 |
| 24 | 137 | 131.648680476079 | 5.35131952392111 |
| 25 | 136 | 131.917230924786 | 4.08276907521441 |
| 26 | 133 | 131.290613211137 | 1.70938678886337 |
| 27 | 126 | 128.963175989012 | -2.96317598901195 |
| 28 | 120 | 130.305928232545 | -10.3059282325454 |
| 29 | 114 | 131.201096394901 | -17.2010963949011 |
| 30 | 116 | 128.963175989012 | -12.9631759890119 |
| 31 | 153 | 130.753512313723 | 22.2464876862768 |
| 32 | 162 | 132.543848638435 | 29.4561513615655 |
| 33 | 161 | 129.052692805248 | 31.9473071947525 |
| 34 | 149 | 128.963175989012 | 20.0368240109880 |
| 35 | 139 | 129.410760070190 | 9.58923992981023 |
| 36 | 135 | 130.037377783839 | 4.96262221616127 |
| 37 | 130 | 130.663995497488 | -0.66399549748768 |
| 38 | 127 | 130.126894600074 | -3.12689460007429 |
| 39 | 122 | 127.888974194185 | -5.88897419418517 |
| 40 | 117 | 129.052692805248 | -12.0526928052475 |
| 41 | 112 | 129.589793702661 | -17.5897937026609 |
| 42 | 113 | 128.336558275363 | -15.336558275363 |
| 43 | 149 | 130.395445048781 | 18.6045549512190 |
| 44 | 157 | 131.469646843608 | 25.5303531563922 |
| 45 | 157 | 127.799457377950 | 29.2005426220504 |
| 46 | 147 | 129.142209621483 | 17.8577903785169 |
| 47 | 137 | 127.888974194185 | 9.11102580581483 |
| 48 | 132 | 128.873659172776 | 3.12634082722362 |
| 49 | 125 | 129.321243253954 | -4.32124325395421 |
| 50 | 123 | 129.052692805248 | -6.05269280524751 |
| 51 | 117 | 126.098637869474 | -9.09863786947387 |
| 52 | 114 | 129.589793702661 | -15.5897937026609 |
| 53 | 111 | 127.620423745478 | -16.6204237454785 |
| 54 | 112 | 127.262356480536 | -15.2623564805362 |
| 55 | 144 | 129.231726437719 | 14.7682735622814 |
| 56 | 150 | 130.484961865017 | 19.5150381349834 |
| 57 | 149 | 127.530906929243 | 21.4690930707571 |
| 58 | 134 | 127.172839664301 | 6.82716033569935 |
| 59 | 123 | 127.083322848065 | -4.08332284806508 |
| 60 | 116 | 129.500276886425 | -13.5002768864253 |
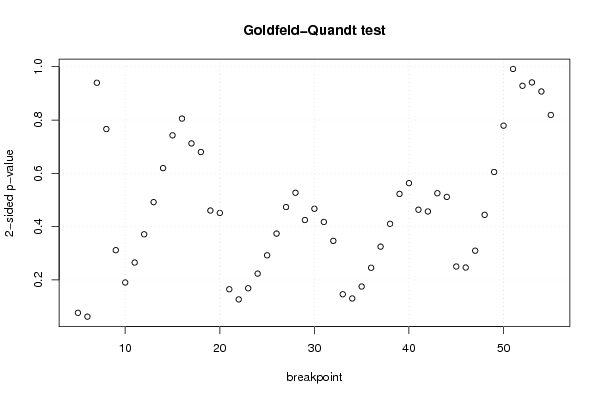
| Goldfeld-Quandt test for Heteroskedasticity | |||
| p-values | Alternative Hypothesis | ||
| breakpoint index | greater | 2-sided | less |
| 5 | 0.0381795061196366 | 0.0763590122392732 | 0.961820493880363 |
| 6 | 0.0310077537428022 | 0.0620155074856045 | 0.968992246257198 |
| 7 | 0.469908876153145 | 0.93981775230629 | 0.530091123846855 |
| 8 | 0.383061490479678 | 0.766122980959357 | 0.616938509520322 |
| 9 | 0.844265560051986 | 0.311468879896029 | 0.155734439948014 |
| 10 | 0.904907577176669 | 0.190184845646663 | 0.0950924228233313 |
| 11 | 0.867444969635386 | 0.265110060729227 | 0.132555030364614 |
| 12 | 0.814458691339773 | 0.371082617320454 | 0.185541308660227 |
| 13 | 0.754121059636899 | 0.491757880726202 | 0.245878940363101 |
| 14 | 0.690277336499956 | 0.619445327000088 | 0.309722663500044 |
| 15 | 0.628706635638769 | 0.742586728722462 | 0.371293364361231 |
| 16 | 0.597302108681462 | 0.805395782637076 | 0.402697891318538 |
| 17 | 0.643935670924609 | 0.712128658150782 | 0.356064329075391 |
| 18 | 0.660061625837718 | 0.679876748324564 | 0.339938374162282 |
| 19 | 0.769831213693297 | 0.460337572613406 | 0.230168786306703 |
| 20 | 0.774391857754078 | 0.451216284491843 | 0.225608142245922 |
| 21 | 0.917556912662216 | 0.164886174675569 | 0.0824430873377845 |
| 22 | 0.936648056527826 | 0.126703886944348 | 0.0633519434721742 |
| 23 | 0.915697365549755 | 0.168605268900491 | 0.0843026344502455 |
| 24 | 0.888221867239413 | 0.223556265521174 | 0.111778132760587 |
| 25 | 0.853842282324067 | 0.292315435351867 | 0.146157717675933 |
| 26 | 0.813167690261477 | 0.373664619477046 | 0.186832309738523 |
| 27 | 0.763326110178082 | 0.473347779643836 | 0.236673889821918 |
| 28 | 0.736493722894809 | 0.527012554210383 | 0.263506277105191 |
| 29 | 0.78767046801986 | 0.424659063960279 | 0.212329531980140 |
| 30 | 0.766522535869982 | 0.466954928260036 | 0.233477464130018 |
| 31 | 0.791263613406888 | 0.417472773186225 | 0.208736386593112 |
| 32 | 0.826766793772205 | 0.346466412455589 | 0.173233206227795 |
| 33 | 0.926911652520695 | 0.146176694958609 | 0.0730883474793046 |
| 34 | 0.934868610766016 | 0.130262778467968 | 0.0651313892339841 |
| 35 | 0.912484756268426 | 0.175030487463149 | 0.0875152437315743 |
| 36 | 0.877255009534209 | 0.245489980931582 | 0.122744990465791 |
| 37 | 0.837651717414504 | 0.324696565170993 | 0.162348282585496 |
| 38 | 0.794822173339261 | 0.410355653321478 | 0.205177826660739 |
| 39 | 0.738662018183318 | 0.522675963633364 | 0.261337981816682 |
| 40 | 0.718408183192274 | 0.563183633615453 | 0.281591816807726 |
| 41 | 0.7683475792426 | 0.463304841514799 | 0.231652420757399 |
| 42 | 0.771598093961841 | 0.456803812076319 | 0.228401906038159 |
| 43 | 0.737380743197964 | 0.525238513604072 | 0.262619256802036 |
| 44 | 0.744332600907101 | 0.511334798185798 | 0.255667399092899 |
| 45 | 0.874919994457929 | 0.250160011084141 | 0.125080005542071 |
| 46 | 0.87680709357556 | 0.246385812848881 | 0.123192906424441 |
| 47 | 0.845209735675864 | 0.309580528648272 | 0.154790264324136 |
| 48 | 0.777923502419209 | 0.444152995161582 | 0.222076497580791 |
| 49 | 0.697591800893872 | 0.604816398212255 | 0.302408199106128 |
| 50 | 0.610585256695129 | 0.778829486609742 | 0.389414743304871 |
| 51 | 0.504172696600286 | 0.99165460679943 | 0.495827303399715 |
| 52 | 0.535797344694117 | 0.928405310611767 | 0.464202655305883 |
| 53 | 0.529408777123264 | 0.941182445753473 | 0.470591222876736 |
| 54 | 0.54644532721174 | 0.90710934557652 | 0.45355467278826 |
| 55 | 0.409422200078793 | 0.818844400157586 | 0.590577799921207 |
| Meta Analysis of Goldfeld-Quandt test for Heteroskedasticity | |||
| Description | # significant tests | % significant tests | OK/NOK |
| 1% type I error level | 0 | 0 | OK |
| 5% type I error level | 0 | 0 | OK |
| 10% type I error level | 2 | 0.0392156862745098 | OK |