| Multiple Linear Regression - Estimated Regression Equation |
| Y[t] = -756.55708054948 + 1.71314936407085X[t] + 0.328377699504215Y1[t] + 0.349916989632899Y2[t] + 0.275562658816889Y3[t] + 0.0704857662751447Y4[t] -152.180602693103M1[t] -237.954081757073M2[t] -1680.21865522304M3[t] -250.234553382229M4[t] + 250.420449060493M5[t] + 67.6731551900197M6[t] -455.587954730776M7[t] -1296.75786254305M8[t] -644.917005983765M9[t] -13.7638107680781M10[t] + 242.583873025313M11[t] + e[t] |
| Multiple Linear Regression - Ordinary Least Squares | |||||
| Variable | Parameter | S.D. | T-STAT H0: parameter = 0 | 2-tail p-value | 1-tail p-value |
| (Intercept) | -756.55708054948 | 641.622659 | -1.1791 | 0.244409 | 0.122205 |
| X | 1.71314936407085 | 1.11706 | 1.5336 | 0.131972 | 0.065986 |
| Y1 | 0.328377699504215 | 0.149809 | 2.192 | 0.03348 | 0.01674 |
| Y2 | 0.349916989632899 | 0.159075 | 2.1997 | 0.032892 | 0.016446 |
| Y3 | 0.275562658816889 | 0.165084 | 1.6692 | 0.101864 | 0.050932 |
| Y4 | 0.0704857662751447 | 0.161581 | 0.4362 | 0.664714 | 0.332357 |
| M1 | -152.180602693103 | 193.935323 | -0.7847 | 0.436653 | 0.218327 |
| M2 | -237.954081757073 | 216.517759 | -1.099 | 0.277485 | 0.138742 |
| M3 | -1680.21865522304 | 239.643717 | -7.0113 | 0 | 0 |
| M4 | -250.234553382229 | 382.435382 | -0.6543 | 0.516165 | 0.258082 |
| M5 | 250.420449060493 | 368.20375 | 0.6801 | 0.499841 | 0.249921 |
| M6 | 67.6731551900197 | 306.698431 | 0.2207 | 0.826341 | 0.413171 |
| M7 | -455.587954730776 | 228.600306 | -1.9929 | 0.052219 | 0.02611 |
| M8 | -1296.75786254305 | 253.985082 | -5.1056 | 6e-06 | 3e-06 |
| M9 | -644.917005983765 | 345.080017 | -1.8689 | 0.068013 | 0.034006 |
| M10 | -13.7638107680781 | 326.709643 | -0.0421 | 0.966579 | 0.483289 |
| M11 | 242.583873025313 | 258.918847 | 0.9369 | 0.353698 | 0.176849 |
| Multiple Linear Regression - Regression Statistics | |
| Multiple R | 0.929890278855997 |
| R-squared | 0.864695930710883 |
| Adjusted R-squared | 0.817633645740756 |
| F-TEST (value) | 18.3734370581399 |
| F-TEST (DF numerator) | 16 |
| F-TEST (DF denominator) | 46 |
| p-value | 7.99360577730113e-15 |
| Multiple Linear Regression - Residual Statistics | |
| Residual Standard Deviation | 306.863173387526 |
| Sum Squared Residuals | 4331590.33034728 |
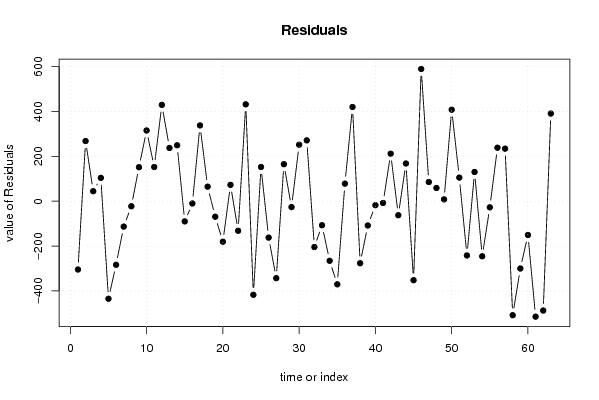
| Multiple Linear Regression - Actuals, Interpolation, and Residuals | |||
| Time or Index | Actuals | Interpolation Forecast | Residuals Prediction Error |
| 1 | 4132 | 4436.39142849006 | -304.391428490064 |
| 2 | 4685 | 4416.68948713523 | 268.310512864772 |
| 3 | 3172 | 3127.31226630106 | 44.6877336989395 |
| 4 | 4280 | 4175.74184051477 | 104.258159485235 |
| 5 | 4207 | 4641.67541648606 | -434.675416486061 |
| 6 | 4158 | 4441.29060229709 | -283.290602297092 |
| 7 | 3933 | 4045.949967263 | -112.949967263002 |
| 8 | 3151 | 3173.44444887357 | -22.4444488735674 |
| 9 | 3616 | 3464.26199307676 | 151.738006923243 |
| 10 | 4221 | 3905.59403315955 | 315.405966840447 |
| 11 | 4436 | 4283.40658190522 | 152.593418094777 |
| 12 | 4807 | 4377.29581711913 | 429.704182880869 |
| 13 | 4849 | 4611.3878874309 | 237.6121125691 |
| 14 | 5024 | 4774.54163387015 | 249.458366129852 |
| 15 | 3521 | 3610.91162448391 | -89.9116244839095 |
| 16 | 4650 | 4660.00856302659 | -10.0085630265941 |
| 17 | 5393 | 5054.94747090377 | 338.052529096232 |
| 18 | 5147 | 5081.9950321317 | 65.0049678682973 |
| 19 | 4845 | 4913.98792733363 | -68.9879273336342 |
| 20 | 3995 | 4175.31615917512 | -180.316159175124 |
| 21 | 4493 | 4420.09095310388 | 72.9090468961155 |
| 22 | 4680 | 4811.64793192611 | -131.647931926107 |
| 23 | 5463 | 5031.01445131381 | 431.985548686187 |
| 24 | 4761 | 5178.02320063416 | -417.023200634164 |
| 25 | 5307 | 5154.22543521137 | 152.774564788628 |
| 26 | 5069 | 5231.05085350148 | -162.050853501484 |
| 27 | 3501 | 3843.95045250839 | -342.950452508393 |
| 28 | 4952 | 4787.01317796726 | 164.986822032744 |
| 29 | 5152 | 5178.09680204959 | -26.0968020495929 |
| 30 | 5317 | 5065.07595898867 | 251.924041011334 |
| 31 | 5189 | 4917.61101782696 | 271.388982173035 |
| 32 | 4030 | 4234.11410211956 | -204.114102119556 |
| 33 | 4420 | 4526.99341969654 | -106.993419696543 |
| 34 | 4571 | 4836.46046547233 | -265.460465472330 |
| 35 | 4551 | 4921.33796900649 | -370.337969006492 |
| 36 | 4819 | 4740.52154506693 | 78.4784549330691 |
| 37 | 5133 | 4712.74999591589 | 420.250004084106 |
| 38 | 4532 | 4808.43917288022 | -276.439172880223 |
| 39 | 3339 | 3447.07097838235 | -108.070978382348 |
| 40 | 4380 | 4397.5487278162 | -17.5487278162044 |
| 41 | 4632 | 4639.71088409858 | -7.71088409858154 |
| 42 | 4719 | 4507.17291875005 | 211.827081249955 |
| 43 | 4212 | 4274.30741954654 | -62.3074195465354 |
| 44 | 3615 | 3446.76286635425 | 168.237133645747 |
| 45 | 3420 | 3772.03013507626 | -352.030135076260 |
| 46 | 4571 | 3981.25288544692 | 589.747114553079 |
| 47 | 4407 | 4321.385057115 | 85.6149428849957 |
| 48 | 4386 | 4326.7475274107 | 59.2524725893004 |
| 49 | 4386 | 4377.73636595731 | 8.26363404268934 |
| 50 | 4744 | 4335.96981532441 | 408.030184675591 |
| 51 | 3185 | 3079.57544498022 | 105.424555019781 |
| 52 | 3890 | 4131.68769067518 | -241.68769067518 |
| 53 | 4520 | 4389.569426462 | 130.430573538004 |
| 54 | 3990 | 4235.46548783249 | -245.465487832494 |
| 55 | 3809 | 3836.14366802986 | -27.1436680298636 |
| 56 | 3236 | 2997.3624234775 | 238.63757652250 |
| 57 | 3551 | 3316.62349904656 | 234.376500953444 |
| 58 | 3264 | 3772.04468399509 | -508.044683995089 |
| 59 | 3579 | 3878.85594065947 | -299.855940659468 |
| 60 | 3537 | 3687.41190976907 | -150.411909769073 |
| 61 | 3038 | 3552.50888699446 | -514.508886994459 |
| 62 | 2888 | 3375.30903728851 | -487.309037288508 |
| 63 | 2198 | 1807.17923334407 | 390.82076665593 |
| Goldfeld-Quandt test for Heteroskedasticity | |||
| p-values | Alternative Hypothesis | ||
| breakpoint index | greater | 2-sided | less |
| 20 | 0.302571286421191 | 0.605142572842382 | 0.697428713578809 |
| 21 | 0.332597326546221 | 0.665194653092443 | 0.667402673453779 |
| 22 | 0.353514083037799 | 0.707028166075598 | 0.646485916962201 |
| 23 | 0.3796156427715 | 0.759231285543 | 0.6203843572285 |
| 24 | 0.576542383356992 | 0.846915233286015 | 0.423457616643008 |
| 25 | 0.482322410990654 | 0.964644821981309 | 0.517677589009346 |
| 26 | 0.394271452488839 | 0.788542904977679 | 0.605728547511161 |
| 27 | 0.462024926765165 | 0.92404985353033 | 0.537975073234835 |
| 28 | 0.406246383363235 | 0.812492766726471 | 0.593753616636765 |
| 29 | 0.307385256195819 | 0.614770512391638 | 0.692614743804181 |
| 30 | 0.371463152421760 | 0.742926304843519 | 0.62853684757824 |
| 31 | 0.506960544410539 | 0.986078911178921 | 0.493039455589461 |
| 32 | 0.408745343487297 | 0.817490686974595 | 0.591254656512703 |
| 33 | 0.347521421004971 | 0.695042842009942 | 0.652478578995029 |
| 34 | 0.297417378686492 | 0.594834757372985 | 0.702582621313508 |
| 35 | 0.330062177990436 | 0.660124355980872 | 0.669937822009564 |
| 36 | 0.264657501060488 | 0.529315002120975 | 0.735342498939512 |
| 37 | 0.363080026965838 | 0.726160053931676 | 0.636919973034162 |
| 38 | 0.284842780335599 | 0.569685560671197 | 0.715157219664401 |
| 39 | 0.238115664409924 | 0.476231328819848 | 0.761884335590076 |
| 40 | 0.153695906420090 | 0.307391812840179 | 0.84630409357991 |
| 41 | 0.0900280416888288 | 0.180056083377658 | 0.909971958311171 |
| 42 | 0.333100729457137 | 0.666201458914275 | 0.666899270542863 |
| 43 | 0.571316113826100 | 0.857367772347799 | 0.428683886173899 |
| Meta Analysis of Goldfeld-Quandt test for Heteroskedasticity | |||
| Description | # significant tests | % significant tests | OK/NOK |
| 1% type I error level | 0 | 0 | OK |
| 5% type I error level | 0 | 0 | OK |
| 10% type I error level | 0 | 0 | OK |