| Multiple Linear Regression - Estimated Regression Equation |
| Y[t] = + 4.65678240334479 -0.0829633938000221X[t] + 1.13419397565917Y1[t] -0.630531861707417Y2[t] -0.0134843776706883t + e[t] |
| Multiple Linear Regression - Ordinary Least Squares | |||||
| Variable | Parameter | S.D. | T-STAT H0: parameter = 0 | 2-tail p-value | 1-tail p-value |
| (Intercept) | 4.65678240334479 | 0.92492 | 5.0348 | 6e-06 | 3e-06 |
| X | -0.0829633938000221 | 0.028815 | -2.8792 | 0.005739 | 0.002869 |
| Y1 | 1.13419397565917 | 0.117757 | 9.6316 | 0 | 0 |
| Y2 | -0.630531861707417 | 0.124907 | -5.048 | 6e-06 | 3e-06 |
| t | -0.0134843776706883 | 0.003752 | -3.5938 | 0.000714 | 0.000357 |
| Multiple Linear Regression - Regression Statistics | |
| Multiple R | 0.922654065517599 |
| R-squared | 0.851290524616153 |
| Adjusted R-squared | 0.84006716798341 |
| F-TEST (value) | 75.8499041305156 |
| F-TEST (DF numerator) | 4 |
| F-TEST (DF denominator) | 53 |
| p-value | 0 |
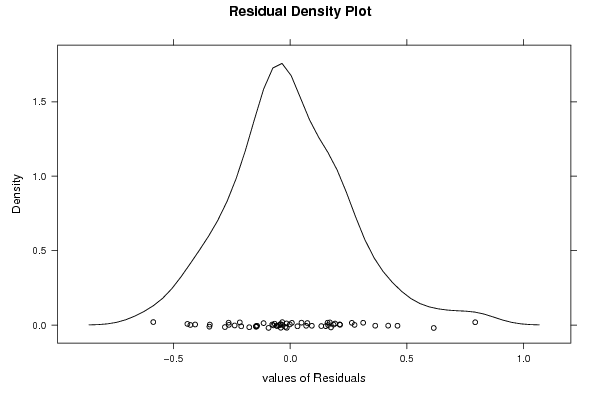
| Multiple Linear Regression - Residual Statistics | |
| Residual Standard Deviation | 0.26644339847414 |
| Sum Squared Residuals | 3.76258048329381 |
| Multiple Linear Regression - Actuals, Interpolation, and Residuals | |||
| Time or Index | Actuals | Interpolation Forecast | Residuals Prediction Error |
| 1 | 8.7 | 8.93742773456528 | -0.23742773456528 |
| 2 | 8.2 | 8.27661232901909 | -0.0766123290190865 |
| 3 | 8.3 | 8.10753543806328 | 0.192464561936723 |
| 4 | 8.5 | 8.51444004943221 | -0.0144400494322090 |
| 5 | 8.6 | 8.6398522625826 | -0.0398522625826046 |
| 6 | 8.5 | 8.57219921323634 | -0.0721992132363381 |
| 7 | 8.2 | 8.415427609349 | -0.215427609349002 |
| 8 | 8.1 | 8.1330345645313 | -0.0330345645313061 |
| 9 | 7.9 | 8.16210499028692 | -0.262104990286917 |
| 10 | 8.6 | 7.98483500365514 | 0.615164996344861 |
| 11 | 8.7 | 8.87480010252734 | -0.174800102527345 |
| 12 | 8.7 | 8.52506647984738 | 0.174933520152621 |
| 13 | 8.5 | 8.51489963104597 | -0.0148996310459668 |
| 14 | 8.4 | 8.26628011886344 | 0.133719881136556 |
| 15 | 8.5 | 8.22400101906831 | 0.275998980931689 |
| 16 | 8.7 | 8.38698922513428 | 0.313010774865719 |
| 17 | 8.7 | 8.53729045642468 | 0.162709543575316 |
| 18 | 8.6 | 8.44747774269253 | 0.152522257307474 |
| 19 | 8.5 | 8.28738860993591 | 0.212611390064088 |
| 20 | 8.3 | 8.20694534211004 | 0.093054657889956 |
| 21 | 8 | 8.05456437361827 | -0.054564373618272 |
| 22 | 8.2 | 7.83522451497132 | 0.364775485028681 |
| 23 | 8.1 | 8.24603483032469 | -0.146034830324690 |
| 24 | 8.1 | 8.02621004026661 | 0.0737899597333881 |
| 25 | 8 | 8.09237152752667 | -0.092371527526669 |
| 26 | 7.9 | 7.94057873415006 | -0.0405787341500577 |
| 27 | 7.9 | 7.8684318057042 | 0.0315681942958075 |
| 28 | 8 | 7.95118597172425 | 0.0488140282757452 |
| 29 | 8 | 8.04282465223948 | -0.0428246522394806 |
| 30 | 7.9 | 7.96628708839805 | -0.0662870883980505 |
| 31 | 8 | 7.83938331316145 | 0.160616686838554 |
| 32 | 7.7 | 8.04385321612743 | -0.343853216127427 |
| 33 | 7.2 | 7.62705745958825 | -0.427057459588247 |
| 34 | 7.5 | 7.2356356526002 | 0.264364347399799 |
| 35 | 7.3 | 7.88597173786097 | -0.585971737860973 |
| 36 | 7 | 7.43989632778622 | -0.439896327786222 |
| 37 | 7 | 7.14588941471925 | -0.145889414719250 |
| 38 | 7 | 7.26349021990077 | -0.263490219900771 |
| 39 | 7.2 | 7.23341316347008 | -0.0334131634700781 |
| 40 | 7.3 | 7.41358222341121 | -0.113582223411215 |
| 41 | 7.1 | 7.37911453158496 | -0.279114531584957 |
| 42 | 6.8 | 7.00936745757168 | -0.209367457571676 |
| 43 | 6.4 | 6.80662027768473 | -0.406620277684728 |
| 44 | 6.1 | 6.44565447446258 | -0.345654474462577 |
| 45 | 6.5 | 6.28605027311709 | 0.213949726882911 |
| 46 | 7.7 | 6.90710670484229 | 0.79289329515771 |
| 47 | 7.9 | 8.04392405017965 | -0.143924050179646 |
| 48 | 7.5 | 7.49234389421189 | 0.0076561057881112 |
| 49 | 6.9 | 6.95714992959607 | -0.0571499295960653 |
| 50 | 6.6 | 6.64810334129288 | -0.0481033412928808 |
| 51 | 6.9 | 6.7141615848489 | 0.185838415151098 |
| 52 | 7.7 | 7.2798729946682 | 0.420127005331797 |
| 53 | 8 | 8.00117691777263 | -0.00117691777262699 |
| 54 | 8 | 7.93137765537378 | 0.0686223446262161 |
| 55 | 7.7 | 7.72043737981087 | -0.0204373798108681 |
| 56 | 7.3 | 7.44136186386245 | -0.141361863862450 |
| 57 | 7.4 | 7.22973016948034 | 0.170269830519662 |
| 58 | 8.1 | 7.63995230971855 | 0.460047690281451 |
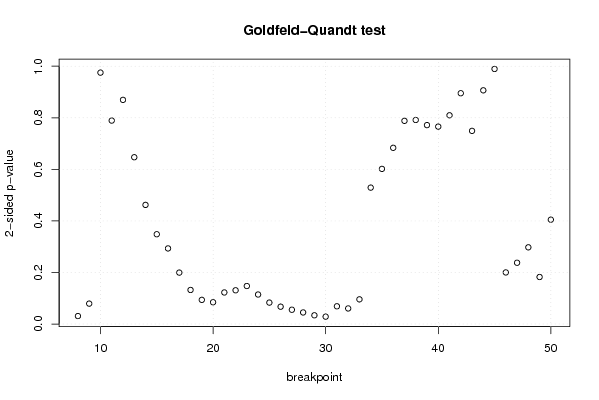
| Goldfeld-Quandt test for Heteroskedasticity | |||
| p-values | Alternative Hypothesis | ||
| breakpoint index | greater | 2-sided | less |
| 8 | 0.0154362647075466 | 0.0308725294150931 | 0.984563735292453 |
| 9 | 0.0395240967016111 | 0.0790481934032221 | 0.960475903298389 |
| 10 | 0.487589535875604 | 0.975179071751207 | 0.512410464124396 |
| 11 | 0.394610638586574 | 0.789221277173149 | 0.605389361413426 |
| 12 | 0.434750544921641 | 0.869501089843283 | 0.565249455078359 |
| 13 | 0.323480909511942 | 0.646961819023884 | 0.676519090488058 |
| 14 | 0.231041769980270 | 0.462083539960540 | 0.76895823001973 |
| 15 | 0.174165524901695 | 0.348331049803390 | 0.825834475098305 |
| 16 | 0.146594062584650 | 0.293188125169300 | 0.85340593741535 |
| 17 | 0.0997169796192663 | 0.199433959238533 | 0.900283020380734 |
| 18 | 0.0660484472603532 | 0.132096894520706 | 0.933951552739647 |
| 19 | 0.0468600973609166 | 0.0937201947218331 | 0.953139902639083 |
| 20 | 0.0422060150245351 | 0.0844120300490702 | 0.957793984975465 |
| 21 | 0.0611890579965765 | 0.122378115993153 | 0.938810942003424 |
| 22 | 0.0653799847534955 | 0.130759969506991 | 0.934620015246505 |
| 23 | 0.0736935639644746 | 0.147387127928949 | 0.926306436035525 |
| 24 | 0.057195088281561 | 0.114390176563122 | 0.942804911718439 |
| 25 | 0.041522441610226 | 0.083044883220452 | 0.958477558389774 |
| 26 | 0.0335973560775033 | 0.0671947121550066 | 0.966402643922497 |
| 27 | 0.0276528863107457 | 0.0553057726214914 | 0.972347113689254 |
| 28 | 0.0224396577690520 | 0.0448793155381039 | 0.977560342230948 |
| 29 | 0.0169004916680975 | 0.033800983336195 | 0.983099508331903 |
| 30 | 0.0142633579720612 | 0.0285267159441224 | 0.985736642027939 |
| 31 | 0.0343608188190876 | 0.0687216376381753 | 0.965639181180912 |
| 32 | 0.0302008538139143 | 0.0604017076278286 | 0.969799146186086 |
| 33 | 0.0478501182947393 | 0.0957002365894786 | 0.95214988170526 |
| 34 | 0.264557528830695 | 0.529115057661389 | 0.735442471169305 |
| 35 | 0.300858320136419 | 0.601716640272838 | 0.69914167986358 |
| 36 | 0.341775886448858 | 0.683551772897717 | 0.658224113551142 |
| 37 | 0.394099088559018 | 0.788198177118037 | 0.605900911440982 |
| 38 | 0.395768682076984 | 0.791537364153968 | 0.604231317923016 |
| 39 | 0.385847424212953 | 0.771694848425906 | 0.614152575787047 |
| 40 | 0.382909507015546 | 0.765819014031091 | 0.617090492984455 |
| 41 | 0.404861156390525 | 0.80972231278105 | 0.595138843609475 |
| 42 | 0.55233847961305 | 0.8953230407739 | 0.44766152038695 |
| 43 | 0.625388439886618 | 0.749223120226763 | 0.374611560113382 |
| 44 | 0.546698974130775 | 0.90660205173845 | 0.453301025869225 |
| 45 | 0.505247483529479 | 0.989505032941041 | 0.494752516470521 |
| 46 | 0.899964519131957 | 0.200070961736085 | 0.100035480868043 |
| 47 | 0.88120285971525 | 0.237594280569502 | 0.118797140284751 |
| 48 | 0.8512236552099 | 0.297552689580199 | 0.148776344790100 |
| 49 | 0.908827264426153 | 0.182345471147695 | 0.0911727355738474 |
| 50 | 0.797629879049607 | 0.404740241900785 | 0.202370120950393 |
| Meta Analysis of Goldfeld-Quandt test for Heteroskedasticity | |||
| Description | # significant tests | % significant tests | OK/NOK |
| 1% type I error level | 0 | 0 | OK |
| 5% type I error level | 4 | 0.0930232558139535 | NOK |
| 10% type I error level | 13 | 0.302325581395349 | NOK |