| Multiple Linear Regression - Estimated Regression Equation |
| y[t] = + 2517.66666666667 -282.916666666667x[t] + e[t] |
| Multiple Linear Regression - Ordinary Least Squares | |||||
| Variable | Parameter | S.D. | T-STAT H0: parameter = 0 | 2-tail p-value | 1-tail p-value |
| (Intercept) | 2517.66666666667 | 53.144233 | 47.3742 | 0 | 0 |
| x | -282.916666666667 | 78.440805 | -3.6068 | 0.000639 | 0.00032 |
| Multiple Linear Regression - Regression Statistics | |
| Multiple R | 0.425034404876779 |
| R-squared | 0.180654245328958 |
| Adjusted R-squared | 0.166767029148093 |
| F-TEST (value) | 13.0086723628510 |
| F-TEST (DF numerator) | 1 |
| F-TEST (DF denominator) | 59 |
| p-value | 0.000639218028440691 |
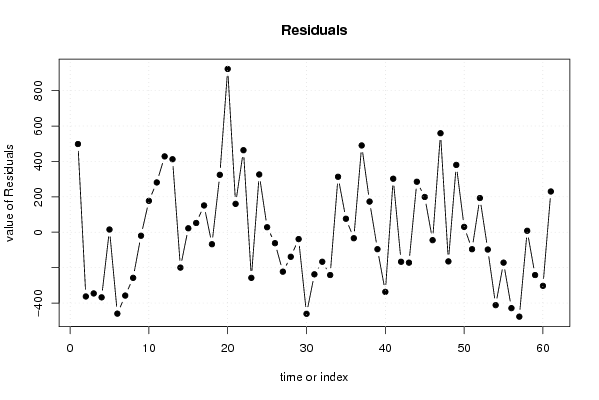
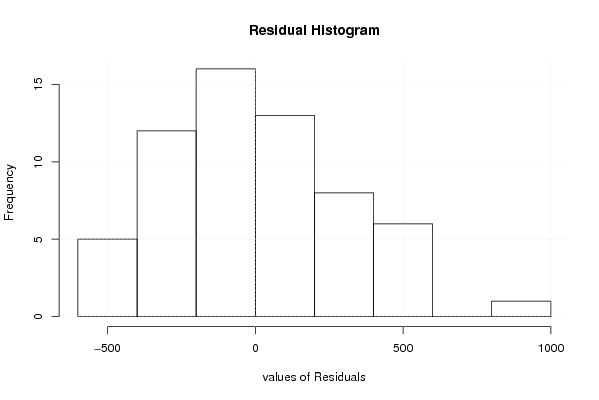
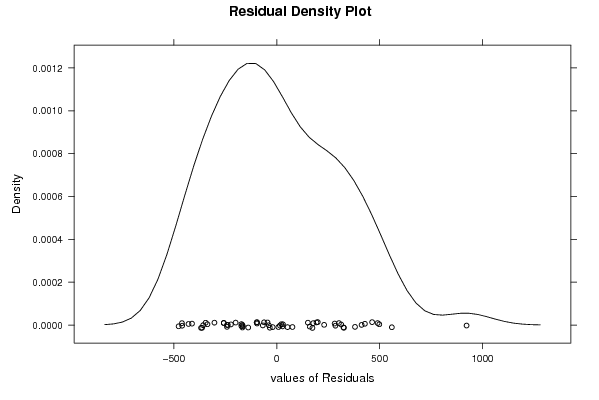
| Multiple Linear Regression - Residual Statistics | |
| Residual Standard Deviation | 305.290375342617 |
| Sum Squared Residuals | 5498930.58333334 |
| Multiple Linear Regression - Actuals, Interpolation, and Residuals | |||
| Time or Index | Actuals | Interpolation Forecast | Residuals Prediction Error |
| 1 | 3016 | 2517.66666666666 | 498.333333333337 |
| 2 | 2155 | 2517.66666666667 | -362.666666666667 |
| 3 | 2172 | 2517.66666666667 | -345.666666666667 |
| 4 | 2150 | 2517.66666666667 | -367.666666666667 |
| 5 | 2533 | 2517.66666666667 | 15.3333333333333 |
| 6 | 2058 | 2517.66666666667 | -459.666666666667 |
| 7 | 2160 | 2517.66666666667 | -357.666666666667 |
| 8 | 2260 | 2517.66666666667 | -257.666666666667 |
| 9 | 2498 | 2517.66666666667 | -19.6666666666667 |
| 10 | 2695 | 2517.66666666667 | 177.333333333333 |
| 11 | 2799 | 2517.66666666667 | 281.333333333333 |
| 12 | 2946 | 2517.66666666667 | 428.333333333333 |
| 13 | 2930 | 2517.66666666667 | 412.333333333333 |
| 14 | 2318 | 2517.66666666667 | -199.666666666667 |
| 15 | 2540 | 2517.66666666667 | 22.3333333333333 |
| 16 | 2570 | 2517.66666666667 | 52.3333333333333 |
| 17 | 2669 | 2517.66666666667 | 151.333333333333 |
| 18 | 2450 | 2517.66666666667 | -67.6666666666667 |
| 19 | 2842 | 2517.66666666667 | 324.333333333333 |
| 20 | 3440 | 2517.66666666667 | 922.333333333333 |
| 21 | 2678 | 2517.66666666667 | 160.333333333333 |
| 22 | 2981 | 2517.66666666667 | 463.333333333333 |
| 23 | 2260 | 2517.66666666667 | -257.666666666667 |
| 24 | 2844 | 2517.66666666667 | 326.333333333333 |
| 25 | 2546 | 2517.66666666667 | 28.3333333333333 |
| 26 | 2456 | 2517.66666666667 | -61.6666666666667 |
| 27 | 2295 | 2517.66666666667 | -222.666666666667 |
| 28 | 2379 | 2517.66666666667 | -138.666666666667 |
| 29 | 2479 | 2517.66666666667 | -38.6666666666667 |
| 30 | 2057 | 2517.66666666667 | -460.666666666667 |
| 31 | 2280 | 2517.66666666667 | -237.666666666667 |
| 32 | 2351 | 2517.66666666667 | -166.666666666667 |
| 33 | 2276 | 2517.66666666667 | -241.666666666667 |
| 34 | 2548 | 2234.75 | 313.25 |
| 35 | 2311 | 2234.75 | 76.25 |
| 36 | 2201 | 2234.75 | -33.75 |
| 37 | 2725 | 2234.75 | 490.25 |
| 38 | 2408 | 2234.75 | 173.25 |
| 39 | 2139 | 2234.75 | -95.75 |
| 40 | 1898 | 2234.75 | -336.75 |
| 41 | 2537 | 2234.75 | 302.25 |
| 42 | 2068 | 2234.75 | -166.75 |
| 43 | 2063 | 2234.75 | -171.75 |
| 44 | 2520 | 2234.75 | 285.25 |
| 45 | 2434 | 2234.75 | 199.25 |
| 46 | 2190 | 2234.75 | -44.75 |
| 47 | 2794 | 2234.75 | 559.25 |
| 48 | 2070 | 2234.75 | -164.75 |
| 49 | 2615 | 2234.75 | 380.25 |
| 50 | 2265 | 2234.75 | 30.25 |
| 51 | 2139 | 2234.75 | -95.75 |
| 52 | 2428 | 2234.75 | 193.25 |
| 53 | 2137 | 2234.75 | -97.75 |
| 54 | 1823 | 2234.75 | -411.75 |
| 55 | 2063 | 2234.75 | -171.75 |
| 56 | 1806 | 2234.75 | -428.75 |
| 57 | 1758 | 2234.75 | -476.75 |
| 58 | 2243 | 2234.75 | 8.25 |
| 59 | 1993 | 2234.75 | -241.75 |
| 60 | 1932 | 2234.75 | -302.75 |
| 61 | 2465 | 2234.75 | 230.25 |
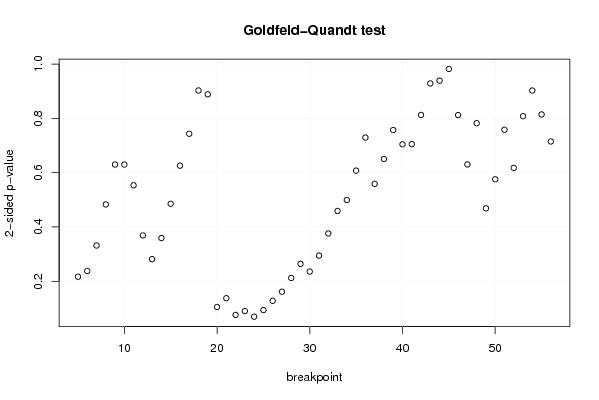
| Goldfeld-Quandt test for Heteroskedasticity | |||
| p-values | Alternative Hypothesis | ||
| breakpoint index | greater | 2-sided | less |
| 5 | 0.891595246791472 | 0.216809506417057 | 0.108404753208528 |
| 6 | 0.880971868877563 | 0.238056262244874 | 0.119028131122437 |
| 7 | 0.834107359907165 | 0.331785280185669 | 0.165892640092835 |
| 8 | 0.758485572954811 | 0.483028854090378 | 0.241514427045189 |
| 9 | 0.685013551721007 | 0.629972896557985 | 0.314986448278993 |
| 10 | 0.685041540024699 | 0.629916919950602 | 0.314958459975301 |
| 11 | 0.723206500122375 | 0.55358699975525 | 0.276793499877625 |
| 12 | 0.815621144471736 | 0.368757711056528 | 0.184378855528264 |
| 13 | 0.859226703591893 | 0.281546592816213 | 0.140773296408107 |
| 14 | 0.82044242729353 | 0.35911514541294 | 0.17955757270647 |
| 15 | 0.757219641865392 | 0.485560716269216 | 0.242780358134608 |
| 16 | 0.687155109170378 | 0.625689781659243 | 0.312844890829622 |
| 17 | 0.628349047097825 | 0.743301905804349 | 0.371650952902175 |
| 18 | 0.548644978700333 | 0.902710042599335 | 0.451355021299667 |
| 19 | 0.555721789177099 | 0.888556421645801 | 0.444278210822901 |
| 20 | 0.94724914447294 | 0.105501711054121 | 0.0527508555270605 |
| 21 | 0.931147516920578 | 0.137704966158845 | 0.0688524830794224 |
| 22 | 0.961903818415758 | 0.0761923631684841 | 0.0380961815842421 |
| 23 | 0.954888173378979 | 0.0902236532420423 | 0.0451118266210212 |
| 24 | 0.965110657255577 | 0.069778685488846 | 0.034889342744423 |
| 25 | 0.953004706652284 | 0.093990586695432 | 0.046995293347716 |
| 26 | 0.935946765217729 | 0.128106469564543 | 0.0640532347822714 |
| 27 | 0.919229899180141 | 0.161540201639718 | 0.0807701008198588 |
| 28 | 0.893865753034297 | 0.212268493931406 | 0.106134246965703 |
| 29 | 0.867955825509379 | 0.264088348981242 | 0.132044174490621 |
| 30 | 0.882096511959724 | 0.235806976080551 | 0.117903488040276 |
| 31 | 0.852683844354748 | 0.294632311290505 | 0.147316155645252 |
| 32 | 0.81195329000153 | 0.376093419996939 | 0.188046709998469 |
| 33 | 0.770461039473286 | 0.459077921053428 | 0.229538960526714 |
| 34 | 0.750245483545229 | 0.499509032909543 | 0.249754516454771 |
| 35 | 0.696225992522312 | 0.607548014955377 | 0.303774007477688 |
| 36 | 0.635300011672201 | 0.729399976655598 | 0.364699988327799 |
| 37 | 0.720613094324097 | 0.558773811351807 | 0.279386905675903 |
| 38 | 0.67481029834571 | 0.650379403308581 | 0.325189701654291 |
| 39 | 0.621494145499451 | 0.757011709001098 | 0.378505854500549 |
| 40 | 0.647758775875968 | 0.704482448248065 | 0.352241224124032 |
| 41 | 0.647477281908312 | 0.705045436183376 | 0.352522718091688 |
| 42 | 0.593687786655344 | 0.812624426689312 | 0.406312213344656 |
| 43 | 0.535721035920664 | 0.928557928158673 | 0.464278964079336 |
| 44 | 0.530528959157399 | 0.938942081685203 | 0.469471040842601 |
| 45 | 0.490978619695723 | 0.981957239391445 | 0.509021380304277 |
| 46 | 0.405985891713414 | 0.811971783426828 | 0.594014108286586 |
| 47 | 0.684802259307937 | 0.630395481384126 | 0.315197740692063 |
| 48 | 0.60894301772732 | 0.78211396454536 | 0.39105698227268 |
| 49 | 0.765731427836984 | 0.468537144326032 | 0.234268572163016 |
| 50 | 0.71218782190786 | 0.575624356184281 | 0.287812178092141 |
| 51 | 0.620902090490984 | 0.758195819018032 | 0.379097909509016 |
| 52 | 0.691182279331287 | 0.617635441337427 | 0.308817720668714 |
| 53 | 0.596001501661979 | 0.807996996676043 | 0.403998498338021 |
| 54 | 0.548767779915692 | 0.902464440168616 | 0.451232220084308 |
| 55 | 0.407223768590516 | 0.814447537181032 | 0.592776231409484 |
| 56 | 0.357421369222171 | 0.714842738444342 | 0.642578630777829 |
| Meta Analysis of Goldfeld-Quandt test for Heteroskedasticity | |||
| Description | # significant tests | % significant tests | OK/NOK |
| 1% type I error level | 0 | 0 | OK |
| 5% type I error level | 0 | 0 | OK |
| 10% type I error level | 4 | 0.0769230769230769 | OK |