| Multiple Linear Regression - Estimated Regression Equation |
| y[t] = + 2680.53846153846 -160.592948717948x[t] + 275.731997863248M1[t] -161.869337606838M2[t] -220.114262820513M3[t] -186.959188034188M4[t] + 4.1958867521367M5[t] -370.449038461539M6[t] -174.893963675214M7[t] + 24.061111111111M8[t] -117.383814102564M9[t] + 122.489850427350M10[t] + 27.644925213675M11[t] -5.1550747863248t + e[t] |
| Multiple Linear Regression - Ordinary Least Squares | |||||
| Variable | Parameter | S.D. | T-STAT H0: parameter = 0 | 2-tail p-value | 1-tail p-value |
| (Intercept) | 2680.53846153846 | 149.452177 | 17.9358 | 0 | 0 |
| x | -160.592948717948 | 144.28271 | -1.113 | 0.27135 | 0.135675 |
| M1 | 275.731997863248 | 167.727573 | 1.6439 | 0.106865 | 0.053432 |
| M2 | -161.869337606838 | 176.134943 | -0.919 | 0.362784 | 0.181392 |
| M3 | -220.114262820513 | 175.815035 | -1.252 | 0.216777 | 0.108389 |
| M4 | -186.959188034188 | 175.589494 | -1.0648 | 0.292428 | 0.146214 |
| M5 | 4.1958867521367 | 175.458683 | 0.0239 | 0.981023 | 0.490511 |
| M6 | -370.449038461539 | 175.422814 | -2.1117 | 0.040052 | 0.020026 |
| M7 | -174.893963675214 | 175.481946 | -0.9966 | 0.324038 | 0.162019 |
| M8 | 24.061111111111 | 175.635981 | 0.137 | 0.891621 | 0.44581 |
| M9 | -117.383814102564 | 175.884672 | -0.6674 | 0.507786 | 0.253893 |
| M10 | 122.489850427350 | 175.019025 | 0.6999 | 0.487461 | 0.24373 |
| M11 | 27.644925213675 | 174.876117 | 0.1581 | 0.875069 | 0.437534 |
| t | -5.1550747863248 | 4.082598 | -1.2627 | 0.212928 | 0.106464 |
| Multiple Linear Regression - Regression Statistics | |
| Multiple R | 0.681821185658193 |
| R-squared | 0.464880129212344 |
| Adjusted R-squared | 0.316868250058311 |
| F-TEST (value) | 3.14082985682895 |
| F-TEST (DF numerator) | 13 |
| F-TEST (DF denominator) | 47 |
| p-value | 0.00197903783503728 |
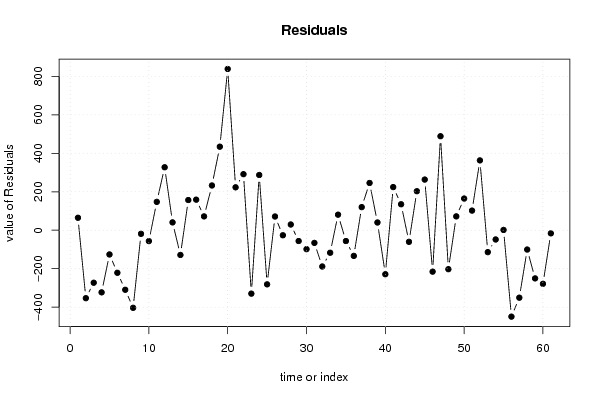
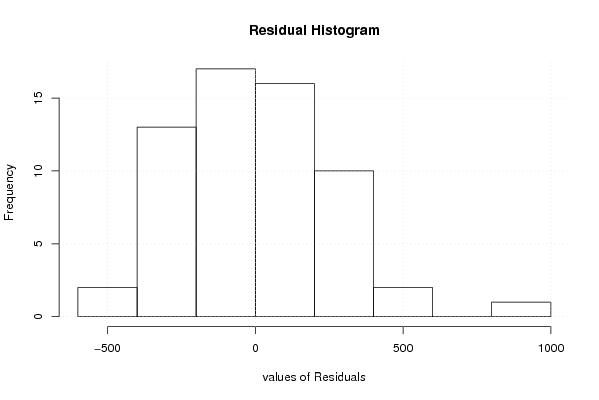
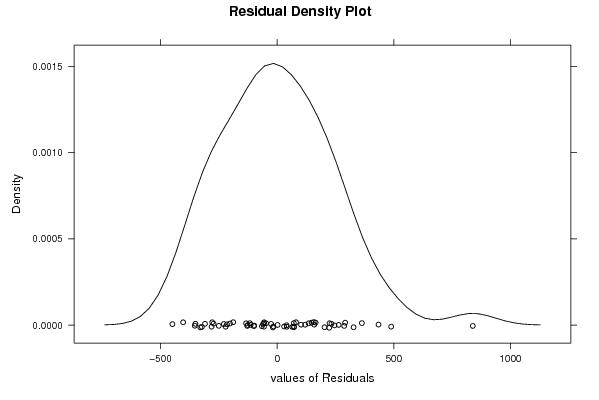
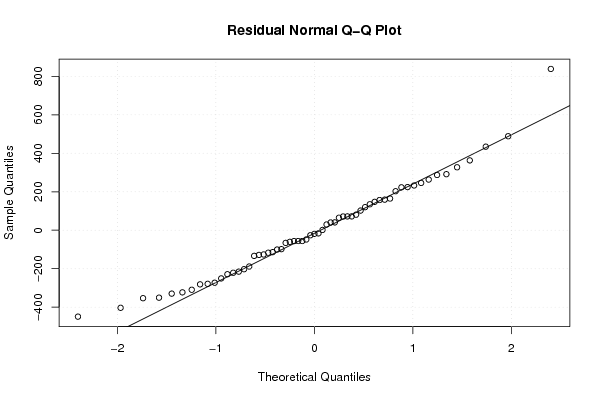
| Multiple Linear Regression - Residual Statistics | |
| Residual Standard Deviation | 276.428059356235 |
| Sum Squared Residuals | 3591386.18397436 |
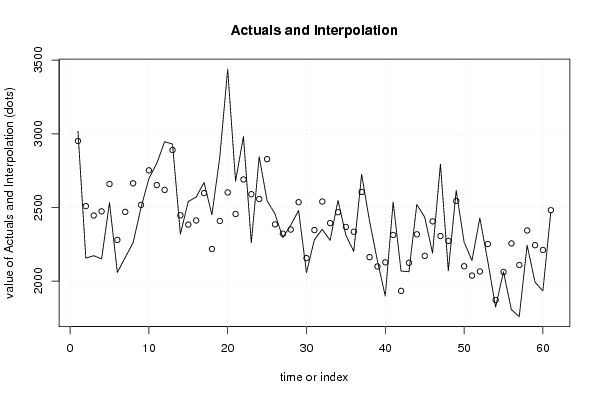
| Multiple Linear Regression - Actuals, Interpolation, and Residuals | |||
| Time or Index | Actuals | Interpolation Forecast | Residuals Prediction Error |
| 1 | 3016 | 2951.11538461538 | 64.8846153846178 |
| 2 | 2155 | 2508.35897435897 | -353.358974358975 |
| 3 | 2172 | 2444.95897435897 | -272.958974358973 |
| 4 | 2150 | 2472.95897435897 | -322.958974358975 |
| 5 | 2533 | 2658.95897435897 | -125.958974358975 |
| 6 | 2058 | 2279.15897435897 | -221.158974358974 |
| 7 | 2160 | 2469.55897435897 | -309.558974358974 |
| 8 | 2260 | 2663.35897435897 | -403.358974358974 |
| 9 | 2498 | 2516.75897435897 | -18.7589743589748 |
| 10 | 2695 | 2751.47756410256 | -56.4775641025641 |
| 11 | 2799 | 2651.47756410256 | 147.522435897436 |
| 12 | 2946 | 2618.67756410256 | 327.322435897436 |
| 13 | 2930 | 2889.25448717949 | 40.745512820512 |
| 14 | 2318 | 2446.49807692308 | -128.498076923077 |
| 15 | 2540 | 2383.09807692308 | 156.901923076923 |
| 16 | 2570 | 2411.09807692308 | 158.901923076923 |
| 17 | 2669 | 2597.09807692308 | 71.9019230769229 |
| 18 | 2450 | 2217.29807692308 | 232.701923076923 |
| 19 | 2842 | 2407.69807692308 | 434.301923076923 |
| 20 | 3440 | 2601.49807692308 | 838.501923076923 |
| 21 | 2678 | 2454.89807692308 | 223.101923076923 |
| 22 | 2981 | 2689.61666666667 | 291.383333333333 |
| 23 | 2260 | 2589.61666666667 | -329.616666666667 |
| 24 | 2844 | 2556.81666666667 | 287.183333333333 |
| 25 | 2546 | 2827.39358974359 | -281.393589743590 |
| 26 | 2456 | 2384.63717948718 | 71.3628205128206 |
| 27 | 2295 | 2321.23717948718 | -26.2371794871795 |
| 28 | 2379 | 2349.23717948718 | 29.7628205128207 |
| 29 | 2479 | 2535.23717948718 | -56.2371794871795 |
| 30 | 2057 | 2155.43717948718 | -98.4371794871793 |
| 31 | 2280 | 2345.83717948718 | -65.8371794871794 |
| 32 | 2351 | 2539.63717948718 | -188.637179487179 |
| 33 | 2276 | 2393.03717948718 | -117.037179487179 |
| 34 | 2548 | 2467.16282051282 | 80.8371794871794 |
| 35 | 2311 | 2367.16282051282 | -56.1628205128206 |
| 36 | 2201 | 2334.36282051282 | -133.362820512821 |
| 37 | 2725 | 2604.93974358974 | 120.060256410256 |
| 38 | 2408 | 2162.18333333333 | 245.816666666667 |
| 39 | 2139 | 2098.78333333333 | 40.2166666666665 |
| 40 | 1898 | 2126.78333333333 | -228.783333333333 |
| 41 | 2537 | 2312.78333333333 | 224.216666666666 |
| 42 | 2068 | 1932.98333333333 | 135.016666666667 |
| 43 | 2063 | 2123.38333333333 | -60.3833333333333 |
| 44 | 2520 | 2317.18333333333 | 202.816666666667 |
| 45 | 2434 | 2170.58333333333 | 263.416666666667 |
| 46 | 2190 | 2405.30192307692 | -215.301923076923 |
| 47 | 2794 | 2305.30192307692 | 488.698076923077 |
| 48 | 2070 | 2272.50192307692 | -202.501923076923 |
| 49 | 2615 | 2543.07884615385 | 71.9211538461533 |
| 50 | 2265 | 2100.32243589744 | 164.677564102564 |
| 51 | 2139 | 2036.92243589744 | 102.077564102564 |
| 52 | 2428 | 2064.92243589744 | 363.077564102564 |
| 53 | 2137 | 2250.92243589744 | -113.922435897436 |
| 54 | 1823 | 1871.12243589744 | -48.1224358974356 |
| 55 | 2063 | 2061.52243589744 | 1.47756410256428 |
| 56 | 1806 | 2255.32243589744 | -449.322435897436 |
| 57 | 1758 | 2108.72243589744 | -350.722435897436 |
| 58 | 2243 | 2343.44102564103 | -100.441025641025 |
| 59 | 1993 | 2243.44102564103 | -250.441025641025 |
| 60 | 1932 | 2210.64102564103 | -278.641025641025 |
| 61 | 2465 | 2481.21794871795 | -16.2179487179491 |
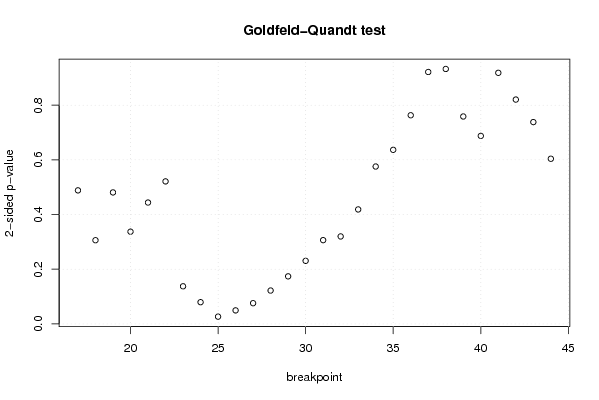
| Goldfeld-Quandt test for Heteroskedasticity | |||
| p-values | Alternative Hypothesis | ||
| breakpoint index | greater | 2-sided | less |
| 17 | 0.244232066086229 | 0.488464132172458 | 0.755767933913771 |
| 18 | 0.153033326099688 | 0.306066652199377 | 0.846966673900312 |
| 19 | 0.240437790037919 | 0.480875580075838 | 0.759562209962081 |
| 20 | 0.831345977359491 | 0.337308045281017 | 0.168654022640509 |
| 21 | 0.778051547296424 | 0.443896905407153 | 0.221948452703576 |
| 22 | 0.739361905654388 | 0.521276188691225 | 0.260638094345612 |
| 23 | 0.93122655969459 | 0.137546880610820 | 0.0687734403054099 |
| 24 | 0.960280704195596 | 0.0794385916088079 | 0.0397192958044039 |
| 25 | 0.986734636089142 | 0.026530727821715 | 0.0132653639108575 |
| 26 | 0.975269724423503 | 0.0494605511529932 | 0.0247302755764966 |
| 27 | 0.962114312997842 | 0.075771374004315 | 0.0378856870021575 |
| 28 | 0.938981467013618 | 0.122037065972764 | 0.0610185329863818 |
| 29 | 0.913020110130058 | 0.173959779739884 | 0.086979889869942 |
| 30 | 0.884653022185775 | 0.230693955628449 | 0.115346977814225 |
| 31 | 0.84683441694698 | 0.306331166106042 | 0.153165583053021 |
| 32 | 0.840034441495371 | 0.319931117009258 | 0.159965558504629 |
| 33 | 0.790669139150319 | 0.418661721699362 | 0.209330860849681 |
| 34 | 0.712182056710331 | 0.575635886579338 | 0.287817943289669 |
| 35 | 0.681650826516773 | 0.636698346966453 | 0.318349173483227 |
| 36 | 0.618440961936779 | 0.763118076126442 | 0.381559038063221 |
| 37 | 0.539283914824337 | 0.921432170351326 | 0.460716085175663 |
| 38 | 0.466273052369094 | 0.932546104738187 | 0.533726947630906 |
| 39 | 0.379322629036224 | 0.758645258072449 | 0.620677370963776 |
| 40 | 0.656144655326702 | 0.687710689346596 | 0.343855344673298 |
| 41 | 0.540807547655307 | 0.918384904689387 | 0.459192452344693 |
| 42 | 0.410298004234944 | 0.820596008469888 | 0.589701995765056 |
| 43 | 0.369094175835393 | 0.738188351670786 | 0.630905824164607 |
| 44 | 0.302046440015824 | 0.604092880031647 | 0.697953559984176 |
| Meta Analysis of Goldfeld-Quandt test for Heteroskedasticity | |||
| Description | # significant tests | % significant tests | OK/NOK |
| 1% type I error level | 0 | 0 | OK |
| 5% type I error level | 2 | 0.0714285714285714 | NOK |
| 10% type I error level | 4 | 0.142857142857143 | NOK |