| Multiple Linear Regression - Estimated Regression Equation |
| y[t] = + 1134.96781186213 + 0.218332264908275`y(t-1)`[t] + 0.311376317013316`y(t-2)`[t] -16.8622480344403x[t] -123.943865589962M1[t] + 61.3837845106491M2[t] + 265.623286709349M3[t] -158.893504322475M4[t] + 61.1246420426986M5[t] + 336.226451123308M6[t] + 92.6391545422365M7[t] + 271.513481458097M8[t] + 177.538679779320M9[t] + 111.471061167625M10[t] + 411.981538275436M11[t] -4.61154711748763t + e[t] |
| Multiple Linear Regression - Ordinary Least Squares | |||||
| Variable | Parameter | S.D. | T-STAT H0: parameter = 0 | 2-tail p-value | 1-tail p-value |
| (Intercept) | 1134.96781186213 | 498.072338 | 2.2787 | 0.027709 | 0.013855 |
| `y(t-1)` | 0.218332264908275 | 0.14134 | 1.5447 | 0.129739 | 0.06487 |
| `y(t-2)` | 0.311376317013316 | 0.143207 | 2.1743 | 0.035231 | 0.017615 |
| x | -16.8622480344403 | 138.659443 | -0.1216 | 0.903775 | 0.451888 |
| M1 | -123.943865589962 | 187.113645 | -0.6624 | 0.511251 | 0.255625 |
| M2 | 61.3837845106491 | 183.662884 | 0.3342 | 0.739838 | 0.369919 |
| M3 | 265.623286709349 | 183.03314 | 1.4512 | 0.153973 | 0.076986 |
| M4 | -158.893504322475 | 176.700822 | -0.8992 | 0.373542 | 0.186771 |
| M5 | 61.1246420426986 | 192.370155 | 0.3177 | 0.752216 | 0.376108 |
| M6 | 336.226451123308 | 186.991295 | 1.7981 | 0.079187 | 0.039593 |
| M7 | 92.6391545422365 | 176.810552 | 0.5239 | 0.603007 | 0.301503 |
| M8 | 271.513481458097 | 180.154126 | 1.5071 | 0.139093 | 0.069546 |
| M9 | 177.538679779320 | 175.627581 | 1.0109 | 0.317728 | 0.158864 |
| M10 | 111.471061167625 | 175.087306 | 0.6367 | 0.527721 | 0.263861 |
| M11 | 411.981538275436 | 175.165311 | 2.352 | 0.023324 | 0.011662 |
| t | -4.61154711748763 | 4.034457 | -1.143 | 0.259346 | 0.129673 |
| Multiple Linear Regression - Regression Statistics | |
| Multiple R | 0.743705558183632 |
| R-squared | 0.553097957273228 |
| Adjusted R-squared | 0.397201895856912 |
| F-TEST (value) | 3.54786357171780 |
| F-TEST (DF numerator) | 15 |
| F-TEST (DF denominator) | 43 |
| p-value | 0.000564374728205697 |
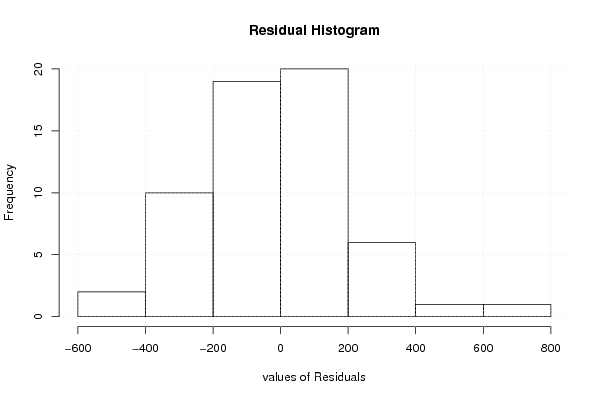
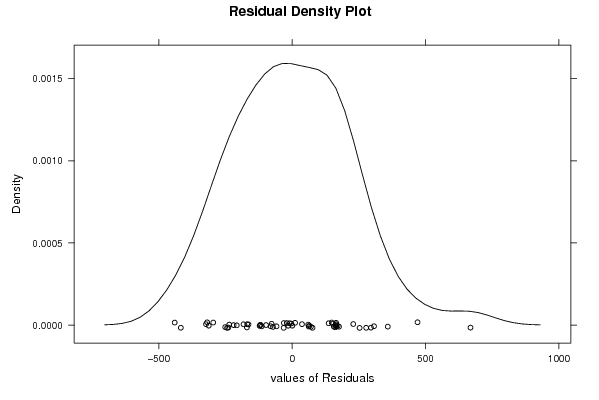
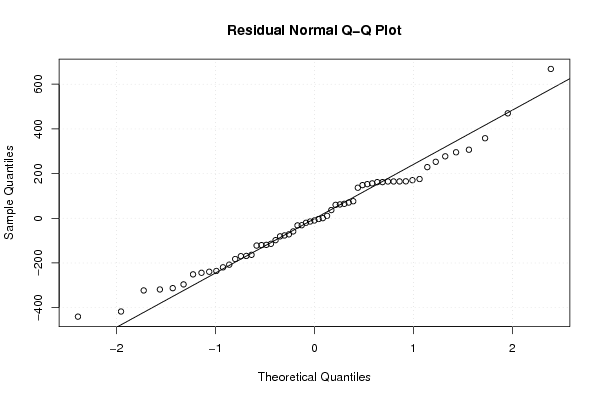
| Multiple Linear Regression - Residual Statistics | |
| Residual Standard Deviation | 255.067585916146 |
| Sum Squared Residuals | 2797557.3555589 |
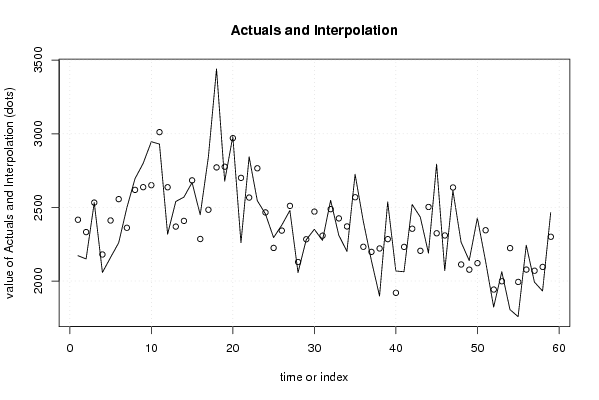
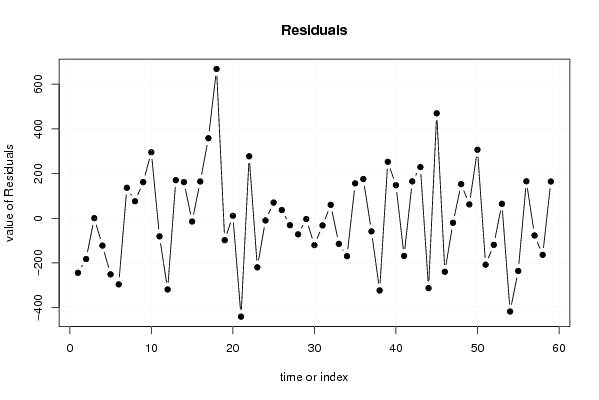
| Multiple Linear Regression - Actuals, Interpolation, and Residuals | |||
| Time or Index | Actuals | Interpolation Forecast | Residuals Prediction Error |
| 1 | 2172 | 2416.02940214417 | -244.029402144172 |
| 2 | 2150 | 2332.36214468227 | -182.362144682273 |
| 3 | 2533 | 2532.48018732473 | 0.519812675270018 |
| 4 | 2058 | 2180.12282766099 | -122.122827660995 |
| 5 | 2160 | 2411.07873049335 | -251.07873049335 |
| 6 | 2260 | 2555.93513289579 | -295.935132895791 |
| 7 | 2498 | 2361.32990002342 | 136.670099976583 |
| 8 | 2695 | 2618.69339057129 | 76.3066094287091 |
| 9 | 2799 | 2637.22606141113 | 161.773938588874 |
| 10 | 2946 | 2650.59458568403 | 295.405414315972 |
| 11 | 2930 | 3010.97149558525 | -80.9714955852525 |
| 12 | 2318 | 2636.65741255475 | -318.657412554754 |
| 13 | 2540 | 2369.50063265123 | 170.499367348773 |
| 14 | 2570 | 2408.12419243184 | 161.875807568162 |
| 15 | 2669 | 2683.42765783726 | -14.4276578372551 |
| 16 | 2450 | 2285.25550342426 | 164.744496575739 |
| 17 | 2842 | 2483.67359204135 | 358.326407958646 |
| 18 | 3440 | 2771.55868842260 | 668.441311577397 |
| 19 | 2678 | 2775.98205540841 | -97.9820554084126 |
| 20 | 2981 | 2970.07868692064 | 10.9213130793577 |
| 21 | 2260 | 2700.37826082744 | -440.378260827438 |
| 22 | 2844 | 2566.62855615442 | 277.371443845576 |
| 23 | 2546 | 2765.53120428458 | -219.531204284579 |
| 24 | 2456 | 2465.71887308477 | -9.7188730847663 |
| 25 | 2295 | 2224.72341406560 | 70.276585934396 |
| 26 | 2379 | 2342.26415386730 | 36.7358461327037 |
| 27 | 2479 | 2510.10043216166 | -31.10043216166 |
| 28 | 2057 | 2128.96093113229 | -71.9609311322941 |
| 29 | 2280 | 2283.36894629002 | -3.36894629001971 |
| 30 | 2351 | 2471.14649754807 | -120.146497548067 |
| 31 | 2276 | 2307.88616335197 | -31.8861633519653 |
| 32 | 2548 | 2487.88174179016 | 60.1182582098372 |
| 33 | 2311 | 2425.32854527295 | -114.328545272950 |
| 34 | 2201 | 2370.73674295369 | -169.736742953689 |
| 35 | 2725 | 2568.82293667195 | 156.177063328055 |
| 36 | 2408 | 2232.38456321949 | 175.615436780507 |
| 37 | 2139 | 2197.7790126511 | -58.7790126510984 |
| 38 | 1898 | 2221.05744388067 | -323.057443880674 |
| 39 | 2537 | 2284.30709384241 | 252.69290615759 |
| 40 | 2068 | 1919.65138056928 | 148.348619430723 |
| 41 | 2063 | 2231.62961414649 | -168.629614146491 |
| 42 | 2520 | 2354.99272210583 | 165.007277894174 |
| 43 | 2434 | 2205.01484188528 | 228.985158114718 |
| 44 | 2190 | 2502.80002377663 | -312.800023776629 |
| 45 | 2794 | 2324.1622390796 | 469.8377609204 |
| 46 | 2070 | 2309.37994000377 | -239.379940003767 |
| 47 | 2615 | 2635.27760567654 | -20.2776056765413 |
| 48 | 2265 | 2112.23915114099 | 152.760848859013 |
| 49 | 2139 | 2076.9675384879 | 62.0324615121014 |
| 50 | 2428 | 2121.19206513792 | 306.807934862082 |
| 51 | 2137 | 2344.68462883394 | -207.684628833945 |
| 52 | 1823 | 1942.00935721317 | -119.009357213173 |
| 53 | 2063 | 1998.24911702879 | 64.7508829712143 |
| 54 | 1806 | 2223.36695902771 | -417.366959027712 |
| 55 | 1758 | 1993.78703933092 | -235.787039330922 |
| 56 | 2243 | 2077.54615694128 | 165.453843058725 |
| 57 | 1993 | 2069.90489340889 | -76.9048934088851 |
| 58 | 1932 | 2095.66017520409 | -163.660175204092 |
| 59 | 2465 | 2300.39675778168 | 164.603242218319 |
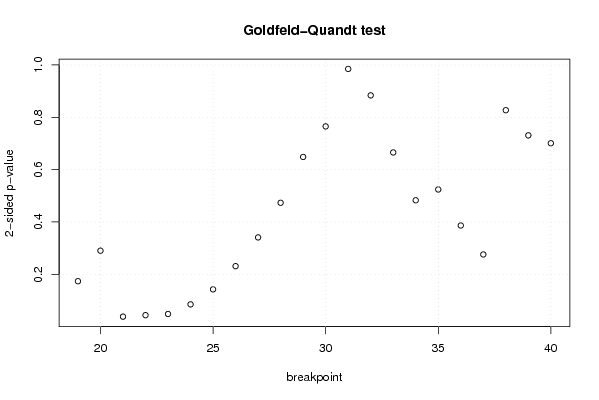
| Goldfeld-Quandt test for Heteroskedasticity | |||
| p-values | Alternative Hypothesis | ||
| breakpoint index | greater | 2-sided | less |
| 19 | 0.913139458707411 | 0.173721082585178 | 0.086860541292589 |
| 20 | 0.854840983633045 | 0.29031803273391 | 0.145159016366955 |
| 21 | 0.980838557513603 | 0.0383228849727935 | 0.0191614424863968 |
| 22 | 0.978033301247529 | 0.0439333975049421 | 0.0219666987524711 |
| 23 | 0.975781318210026 | 0.0484373635799474 | 0.0242186817899737 |
| 24 | 0.957350307825548 | 0.0852993843489043 | 0.0426496921744522 |
| 25 | 0.928675355931751 | 0.142649288136497 | 0.0713246440682487 |
| 26 | 0.884412605573297 | 0.231174788853406 | 0.115587394426703 |
| 27 | 0.829456693189296 | 0.341086613621408 | 0.170543306810704 |
| 28 | 0.763285910651033 | 0.473428178697934 | 0.236714089348967 |
| 29 | 0.675783126205895 | 0.648433747588211 | 0.324216873794105 |
| 30 | 0.61742893349789 | 0.76514213300422 | 0.38257106650211 |
| 31 | 0.507656743181303 | 0.984686513637394 | 0.492343256818697 |
| 32 | 0.44188878156739 | 0.88377756313478 | 0.55811121843261 |
| 33 | 0.332815105596054 | 0.665630211192108 | 0.667184894403946 |
| 34 | 0.241437605501304 | 0.482875211002607 | 0.758562394498696 |
| 35 | 0.262087191526620 | 0.524174383053241 | 0.73791280847338 |
| 36 | 0.193284321425304 | 0.386568642850608 | 0.806715678574696 |
| 37 | 0.137980754560365 | 0.27596150912073 | 0.862019245439635 |
| 38 | 0.413516857845543 | 0.827033715691085 | 0.586483142154457 |
| 39 | 0.365474140726633 | 0.730948281453267 | 0.634525859273367 |
| 40 | 0.35044714797364 | 0.70089429594728 | 0.64955285202636 |
| Meta Analysis of Goldfeld-Quandt test for Heteroskedasticity | |||
| Description | # significant tests | % significant tests | OK/NOK |
| 1% type I error level | 0 | 0 | OK |
| 5% type I error level | 3 | 0.136363636363636 | NOK |
| 10% type I error level | 4 | 0.181818181818182 | NOK |