| Multiple Linear Regression - Estimated Regression Equation |
| Y[t] = + 9.57163647419904 -0.895777001450823X[t] + 0.510443451262783Y1[t] + 0.069926144750079Y2[t] + 0.32209278622004Y3[t] + 0.184045519935524M1[t] + 0.42493619565798M2[t] -0.266547955685569M3[t] -0.0195626395711653M4[t] -0.347632735869259M5[t] + 0.085924062365643M6[t] -0.976484902148307M7[t] + 0.589330506720091M8[t] + 0.698736392866317M9[t] -0.536921805692414M10[t] -0.228775212256733M11[t] + 0.00858164404031952t + e[t] |
| Multiple Linear Regression - Ordinary Least Squares | |||||
| Variable | Parameter | S.D. | T-STAT H0: parameter = 0 | 2-tail p-value | 1-tail p-value |
| (Intercept) | 9.57163647419904 | 11.290167 | 0.8478 | 0.40148 | 0.20074 |
| X | -0.895777001450823 | 0.439234 | -2.0394 | 0.04789 | 0.023945 |
| Y1 | 0.510443451262783 | 0.149766 | 3.4083 | 0.001478 | 0.000739 |
| Y2 | 0.069926144750079 | 0.171956 | 0.4067 | 0.686379 | 0.343189 |
| Y3 | 0.32209278622004 | 0.160887 | 2.002 | 0.051932 | 0.025966 |
| M1 | 0.184045519935524 | 0.669672 | 0.2748 | 0.784827 | 0.392414 |
| M2 | 0.42493619565798 | 0.659722 | 0.6441 | 0.523089 | 0.261544 |
| M3 | -0.266547955685569 | 0.647923 | -0.4114 | 0.68293 | 0.341465 |
| M4 | -0.0195626395711653 | 0.653785 | -0.0299 | 0.976274 | 0.488137 |
| M5 | -0.347632735869259 | 0.624573 | -0.5566 | 0.580831 | 0.290416 |
| M6 | 0.085924062365643 | 0.642128 | 0.1338 | 0.894206 | 0.447103 |
| M7 | -0.976484902148307 | 0.637742 | -1.5312 | 0.13341 | 0.066705 |
| M8 | 0.589330506720091 | 0.652546 | 0.9031 | 0.371736 | 0.185868 |
| M9 | 0.698736392866317 | 0.642181 | 1.0881 | 0.28292 | 0.14146 |
| M10 | -0.536921805692414 | 0.752804 | -0.7132 | 0.479744 | 0.239872 |
| M11 | -0.228775212256733 | 0.74094 | -0.3088 | 0.759065 | 0.379532 |
| t | 0.00858164404031952 | 0.011222 | 0.7647 | 0.448802 | 0.224401 |
| Multiple Linear Regression - Regression Statistics | |
| Multiple R | 0.861077793082703 |
| R-squared | 0.741454965740179 |
| Adjusted R-squared | 0.640559342614395 |
| F-TEST (value) | 7.3487327078185 |
| F-TEST (DF numerator) | 16 |
| F-TEST (DF denominator) | 41 |
| p-value | 1.28898840601188e-07 |
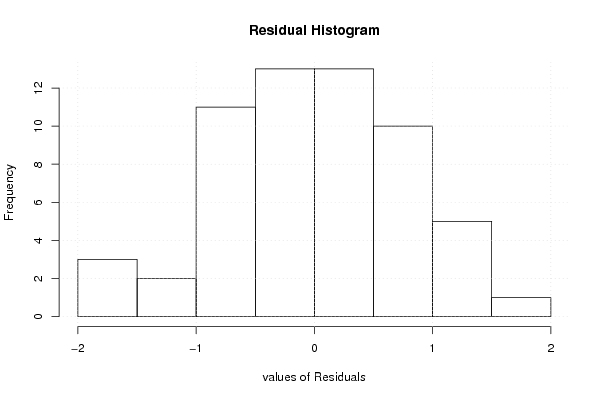
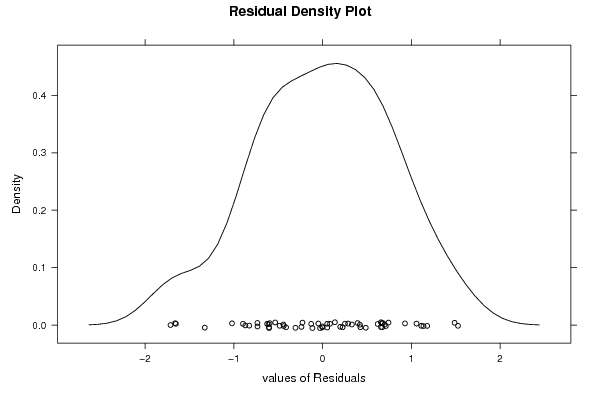
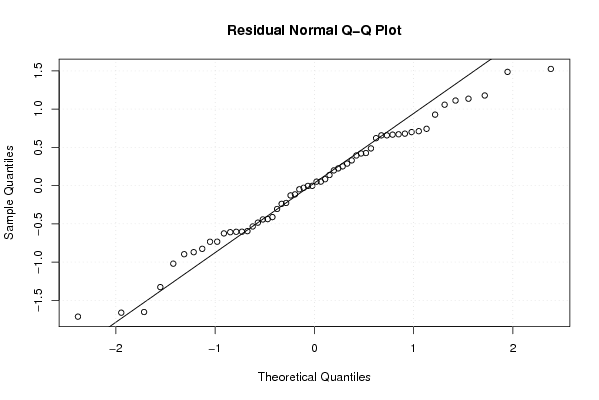
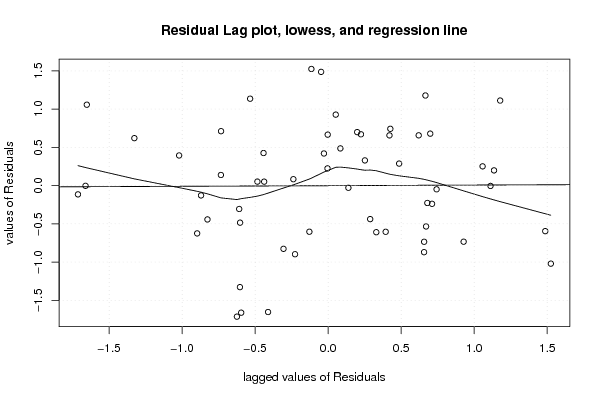
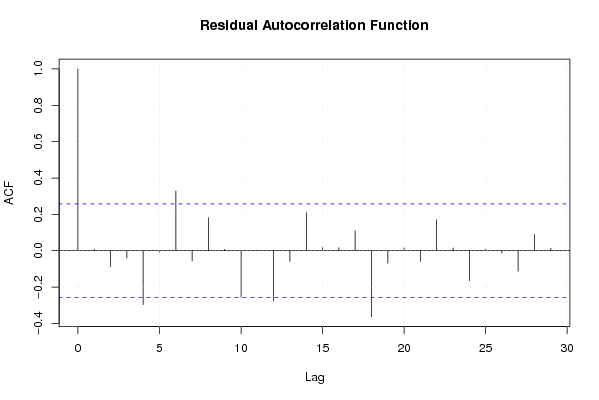
| Multiple Linear Regression - Residual Statistics | |
| Residual Standard Deviation | 0.902740058097228 |
| Sum Squared Residuals | 33.4125241122289 |
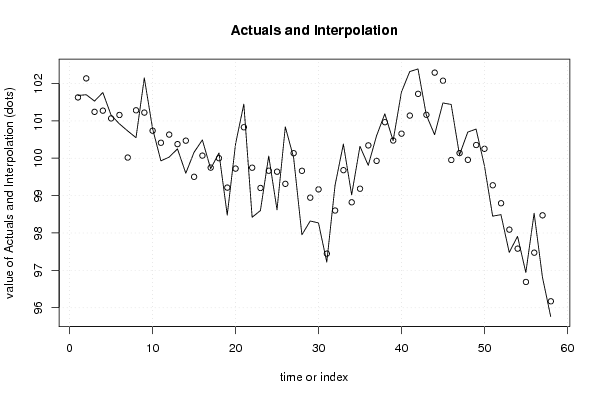
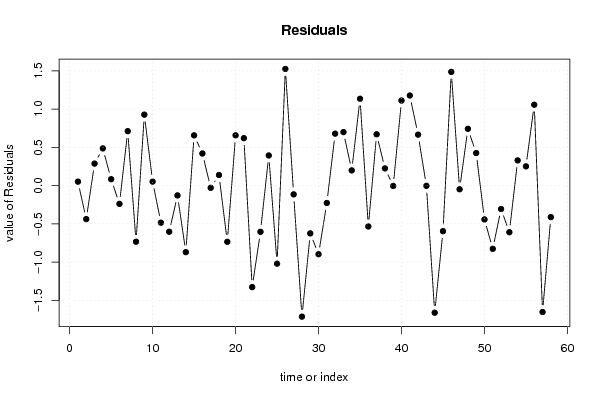
| Multiple Linear Regression - Actuals, Interpolation, and Residuals | |||
| Time or Index | Actuals | Interpolation Forecast | Residuals Prediction Error |
| 1 | 101.68 | 101.628118532882 | 0.0518814671180148 |
| 2 | 101.7 | 102.137934795428 | -0.437934795428357 |
| 3 | 101.53 | 101.241917243176 | 0.288082756824178 |
| 4 | 101.76 | 101.273607441436 | 0.486392558563743 |
| 5 | 101.15 | 101.066075394086 | 0.0839246059141901 |
| 6 | 100.92 | 101.158170570726 | -0.23817057072585 |
| 7 | 100.73 | 100.018367648995 | 0.711632351005163 |
| 8 | 100.55 | 101.283220833277 | -0.733220833276891 |
| 9 | 102.15 | 101.221961233903 | 0.928038766097003 |
| 10 | 100.79 | 100.737809865968 | 0.0521901340317782 |
| 11 | 99.93 | 100.414240139807 | -0.484240139807354 |
| 12 | 100.03 | 100.632864529110 | -0.602864529110379 |
| 13 | 100.25 | 100.378353364468 | -0.128353364468177 |
| 14 | 99.6 | 100.470116061835 | -0.870116061834543 |
| 15 | 100.16 | 99.5030183416775 | 0.656981658322482 |
| 16 | 100.49 | 100.069842053420 | 0.420157946579741 |
| 17 | 99.72 | 99.7485982700962 | -0.0285982700962151 |
| 18 | 100.14 | 100.001142842950 | 0.138857157050156 |
| 19 | 98.48 | 99.2141492600016 | -0.734149260001632 |
| 20 | 100.38 | 99.7225677192197 | 0.657432280780257 |
| 21 | 101.45 | 100.829599376733 | 0.62040062326715 |
| 22 | 98.42 | 99.7468829649655 | -1.32688296496551 |
| 23 | 98.6 | 99.203764813816 | -0.60376481381594 |
| 24 | 100.06 | 99.665764554003 | 0.394235445997012 |
| 25 | 98.62 | 99.6402847206308 | -1.02028472063079 |
| 26 | 100.84 | 99.31478734343 | 1.52521265657012 |
| 27 | 100.02 | 100.134631117371 | -0.114631117371182 |
| 28 | 97.95 | 99.6630568766787 | -1.71305687667873 |
| 29 | 98.32 | 98.9446570270204 | -0.624657027020433 |
| 30 | 98.27 | 99.1667963419298 | -0.896796341929778 |
| 31 | 97.22 | 97.446587454975 | -0.226587454975053 |
| 32 | 99.28 | 98.6006969077218 | 0.679303092278244 |
| 33 | 100.38 | 99.680670856211 | 0.699329143788943 |
| 34 | 99.02 | 98.8209325307358 | 0.199067469264175 |
| 35 | 100.32 | 99.1838875733328 | 1.13611242666718 |
| 36 | 99.81 | 100.344023424253 | -0.53402342425341 |
| 37 | 100.6 | 99.929182227001 | 0.670817772998906 |
| 38 | 101.19 | 100.964963161525 | 0.225036838475027 |
| 39 | 100.47 | 100.474196623847 | -0.00419662384713008 |
| 40 | 101.77 | 100.657954025609 | 1.11204597439097 |
| 41 | 102.32 | 101.141729979643 | 1.17827002035736 |
| 42 | 102.39 | 101.723609502209 | 0.66639049779094 |
| 43 | 101.16 | 101.162693225022 | -0.00269322502242635 |
| 44 | 100.63 | 102.291290695431 | -1.66129069543145 |
| 45 | 101.48 | 102.075280533442 | -0.595280533441516 |
| 46 | 101.44 | 99.9530689272775 | 1.48693107272254 |
| 47 | 100.09 | 100.138107473044 | -0.0481074730438910 |
| 48 | 100.7 | 99.9573474926332 | 0.742652507366776 |
| 49 | 100.78 | 100.354061155018 | 0.425938844982044 |
| 50 | 99.81 | 100.252198637782 | -0.442198637782247 |
| 51 | 98.45 | 99.2762366739284 | -0.82623667392835 |
| 52 | 98.49 | 98.7955396028557 | -0.305539602855722 |
| 53 | 97.48 | 98.088939329155 | -0.6089393291549 |
| 54 | 97.91 | 97.5802807421855 | 0.32971925781453 |
| 55 | 96.94 | 96.688202411006 | 0.251797588993949 |
| 56 | 98.53 | 97.4722238443502 | 1.05777615564984 |
| 57 | 96.82 | 98.4724879997116 | -1.65248799971158 |
| 58 | 95.76 | 96.171305711053 | -0.411305711052982 |
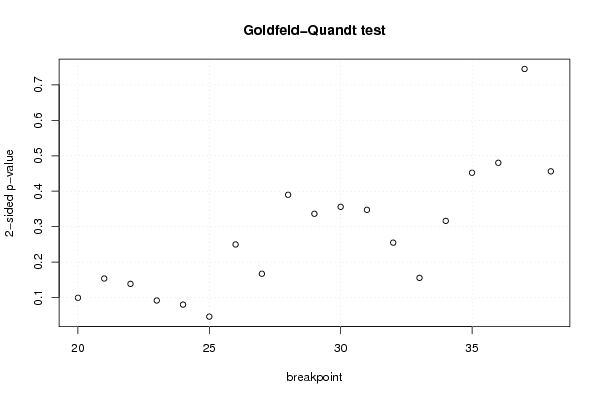
| Goldfeld-Quandt test for Heteroskedasticity | |||
| p-values | Alternative Hypothesis | ||
| breakpoint index | greater | 2-sided | less |
| 20 | 0.0497432174902092 | 0.0994864349804184 | 0.95025678250979 |
| 21 | 0.0769172776722236 | 0.153834555344447 | 0.923082722327776 |
| 22 | 0.0693973546435627 | 0.138794709287125 | 0.930602645356437 |
| 23 | 0.0459058333298366 | 0.0918116666596731 | 0.954094166670163 |
| 24 | 0.0401385862178826 | 0.0802771724357652 | 0.959861413782117 |
| 25 | 0.0231356869383544 | 0.0462713738767088 | 0.976864313061646 |
| 26 | 0.124936436979262 | 0.249872873958525 | 0.875063563020738 |
| 27 | 0.083613121285817 | 0.167226242571634 | 0.916386878714183 |
| 28 | 0.195009651661356 | 0.390019303322713 | 0.804990348338644 |
| 29 | 0.168209176478803 | 0.336418352957607 | 0.831790823521196 |
| 30 | 0.178003992086628 | 0.356007984173256 | 0.821996007913372 |
| 31 | 0.173738660072794 | 0.347477320145588 | 0.826261339927206 |
| 32 | 0.127453561183697 | 0.254907122367394 | 0.872546438816303 |
| 33 | 0.0778284502389225 | 0.155656900477845 | 0.922171549761078 |
| 34 | 0.158216087292043 | 0.316432174584085 | 0.841783912707957 |
| 35 | 0.226008742511805 | 0.452017485023609 | 0.773991257488195 |
| 36 | 0.24010492036141 | 0.48020984072282 | 0.75989507963859 |
| 37 | 0.372432775181059 | 0.744865550362118 | 0.627567224818941 |
| 38 | 0.228060311071386 | 0.456120622142773 | 0.771939688928614 |
| Meta Analysis of Goldfeld-Quandt test for Heteroskedasticity | |||
| Description | # significant tests | % significant tests | OK/NOK |
| 1% type I error level | 0 | 0 | OK |
| 5% type I error level | 1 | 0.0526315789473684 | NOK |
| 10% type I error level | 4 | 0.210526315789474 | NOK |