| Multiple Linear Regression - Estimated Regression Equation |
| tot.ind.prod.index[t] = + 8.93968106591842 + 0.0278761866410181prijsindex.grondst.incl.energie[t] + 0.0209391269251189`y(t-1)`[t] + 0.327716059508625`y(t-2)`[t] + 0.645907122351861`y(t-3)`[t] -6.5190957391177M1[t] -11.7428285168030M2[t] -6.29787050803359M3[t] -28.2519629104457M4[t] -18.8007596663826M5[t] -1.50640187826471M6[t] + 11.9119058393715M7[t] -6.17371142112734M8[t] -22.9232796894441M9[t] -20.3332537513160M10[t] -13.2633906802557M11[t] -0.147205196270872t + e[t] |
| Multiple Linear Regression - Ordinary Least Squares | |||||
| Variable | Parameter | S.D. | T-STAT H0: parameter = 0 | 2-tail p-value | 1-tail p-value |
| (Intercept) | 8.93968106591842 | 26.166019 | 0.3417 | 0.734358 | 0.367179 |
| prijsindex.grondst.incl.energie | 0.0278761866410181 | 0.015012 | 1.857 | 0.070511 | 0.035256 |
| `y(t-1)` | 0.0209391269251189 | 0.139073 | 0.1506 | 0.881059 | 0.44053 |
| `y(t-2)` | 0.327716059508625 | 0.146297 | 2.2401 | 0.030569 | 0.015284 |
| `y(t-3)` | 0.645907122351861 | 0.159049 | 4.0611 | 0.000215 | 0.000107 |
| M1 | -6.5190957391177 | 2.959739 | -2.2026 | 0.033303 | 0.016651 |
| M2 | -11.7428285168030 | 3.114127 | -3.7708 | 0.000514 | 0.000257 |
| M3 | -6.29787050803359 | 3.308044 | -1.9038 | 0.063971 | 0.031985 |
| M4 | -28.2519629104457 | 3.155708 | -8.9527 | 0 | 0 |
| M5 | -18.8007596663826 | 3.857053 | -4.8744 | 1.7e-05 | 8e-06 |
| M6 | -1.50640187826471 | 3.817827 | -0.3946 | 0.695205 | 0.347602 |
| M7 | 11.9119058393715 | 3.812479 | 3.1245 | 0.003266 | 0.001633 |
| M8 | -6.17371142112734 | 3.68833 | -1.6739 | 0.101774 | 0.050887 |
| M9 | -22.9232796894441 | 4.121535 | -5.5618 | 2e-06 | 1e-06 |
| M10 | -20.3332537513160 | 3.579621 | -5.6803 | 1e-06 | 1e-06 |
| M11 | -13.2633906802557 | 3.119782 | -4.2514 | 0.00012 | 6e-05 |
| t | -0.147205196270872 | 0.060013 | -2.4529 | 0.018514 | 0.009257 |
| Multiple Linear Regression - Regression Statistics | |
| Multiple R | 0.929546668821959 |
| R-squared | 0.864057009518 |
| Adjusted R-squared | 0.811006086403074 |
| F-TEST (value) | 16.2873133733443 |
| F-TEST (DF numerator) | 16 |
| F-TEST (DF denominator) | 41 |
| p-value | 6.66466881682481e-13 |
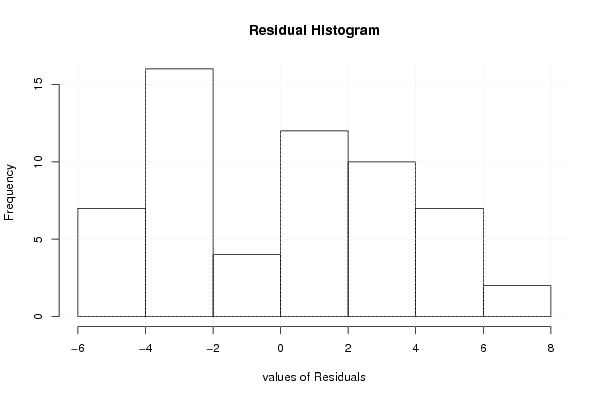
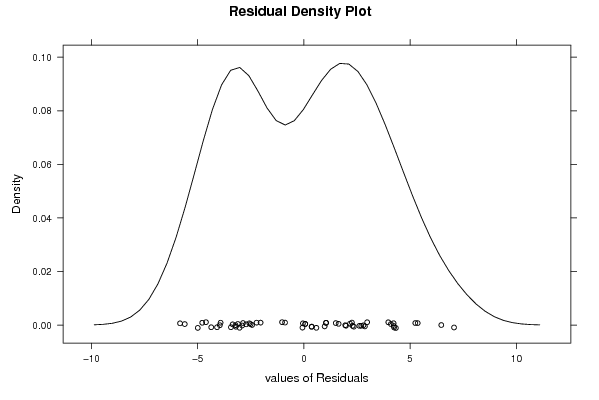
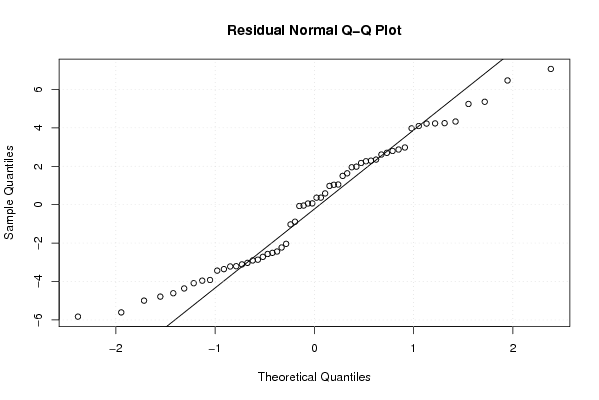
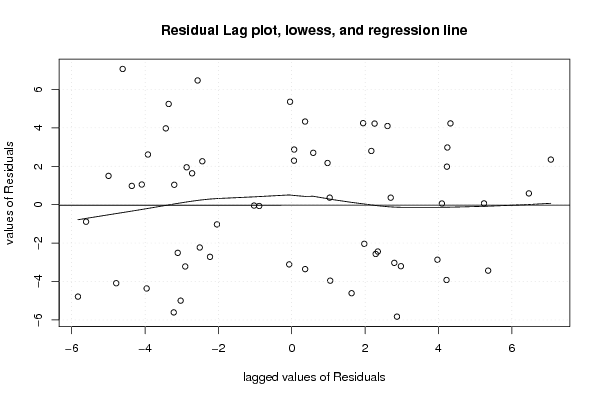
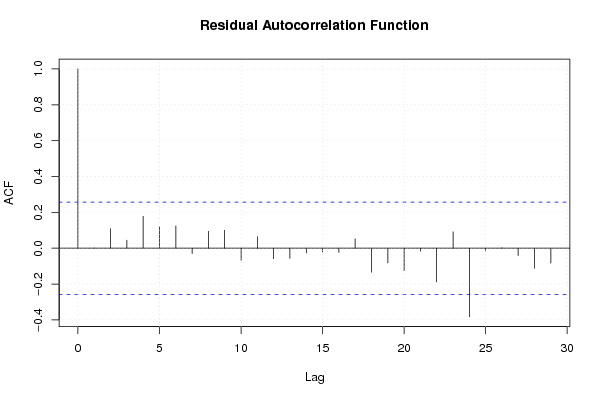
| Multiple Linear Regression - Residual Statistics | |
| Residual Standard Deviation | 3.97108867293895 |
| Sum Squared Residuals | 646.551355182106 |
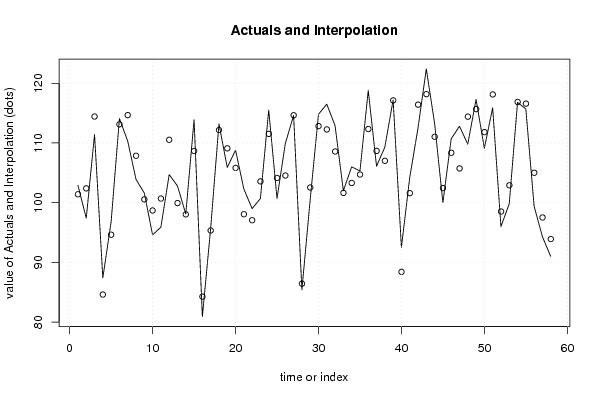
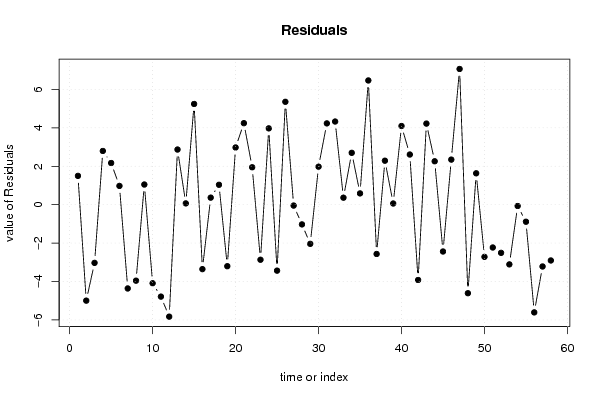
| Multiple Linear Regression - Actuals, Interpolation, and Residuals | |||
| Time or Index | Actuals | Interpolation Forecast | Residuals Prediction Error |
| 1 | 102.9 | 101.401658639719 | 1.49834136028072 |
| 2 | 97.4 | 102.395803813802 | -4.99580381380193 |
| 3 | 111.4 | 114.429462543357 | -3.02946254335714 |
| 4 | 87.4 | 84.6032769605083 | 2.79672303949167 |
| 5 | 96.8 | 94.6298296914422 | 2.17017030855783 |
| 6 | 114.1 | 113.123448174463 | 0.976551825536647 |
| 7 | 110.3 | 114.661708998270 | -4.36170899826953 |
| 8 | 103.9 | 107.856172671007 | -3.95617267100652 |
| 9 | 101.6 | 100.550764822173 | 1.04923517782681 |
| 10 | 94.6 | 98.6890833047051 | -4.08908330470515 |
| 11 | 95.9 | 100.686331898997 | -4.78633189899693 |
| 12 | 104.7 | 110.529609860240 | -5.82960986024025 |
| 13 | 102.8 | 99.9299533133781 | 2.87004668662187 |
| 14 | 98.1 | 98.0337401811899 | 0.0662598188101135 |
| 15 | 113.9 | 108.656791687104 | 5.24320831289639 |
| 16 | 80.9 | 84.2554365962194 | -3.35543659621941 |
| 17 | 95.7 | 95.333957485701 | 0.36604251429894 |
| 18 | 113.2 | 112.16498601343 | 1.03501398656999 |
| 19 | 105.9 | 109.103625931317 | -3.20362593131658 |
| 20 | 108.8 | 105.822846231043 | 2.97715376895690 |
| 21 | 102.3 | 98.0567379051368 | 4.24326209486323 |
| 22 | 99 | 97.0530907436357 | 1.94690925636427 |
| 23 | 100.7 | 103.565997207664 | -2.86599720766351 |
| 24 | 115.5 | 111.527123713007 | 3.97287628699327 |
| 25 | 100.7 | 104.134356055685 | -3.43435605568510 |
| 26 | 109.9 | 104.543927343832 | 5.35607265616787 |
| 27 | 114.6 | 114.645981200878 | -0.0459812008781376 |
| 28 | 85.4 | 86.427598837779 | -1.02759883777902 |
| 29 | 100.5 | 102.538670155411 | -2.03867015541112 |
| 30 | 114.8 | 112.821730571158 | 1.97826942884230 |
| 31 | 116.5 | 112.268428114986 | 4.23157188501364 |
| 32 | 112.9 | 108.572066983086 | 4.32793301691394 |
| 33 | 102 | 101.636024636141 | 0.363975363858816 |
| 34 | 106 | 103.300553252713 | 2.69944674728739 |
| 35 | 105.3 | 104.713447380479 | 0.586552619521113 |
| 36 | 118.8 | 112.333550141120 | 6.46644985887962 |
| 37 | 106.1 | 108.666545093306 | -2.56654509330558 |
| 38 | 109.3 | 107.010074881113 | 2.28992511888722 |
| 39 | 117.2 | 117.138868876906 | 0.0611311230941532 |
| 40 | 92.5 | 88.4054765064953 | 4.09452349350471 |
| 41 | 104.2 | 101.588889245120 | 2.61111075488027 |
| 42 | 112.5 | 116.421190111643 | -3.92119011164308 |
| 43 | 122.4 | 118.178540253583 | 4.22145974641741 |
| 44 | 113.3 | 111.040660266248 | 2.25933973375173 |
| 45 | 100 | 102.438891248742 | -2.43889124874154 |
| 46 | 110.7 | 108.352787830606 | 2.34721216939407 |
| 47 | 112.8 | 105.734223512861 | 7.06577648713933 |
| 48 | 109.8 | 114.409716285633 | -4.60971628563265 |
| 49 | 117.3 | 115.667486897912 | 1.63251310208809 |
| 50 | 109.1 | 111.816453780063 | -2.71645378006328 |
| 51 | 115.9 | 118.128895691755 | -2.22889569175527 |
| 52 | 96 | 98.508211098998 | -2.50821109899796 |
| 53 | 99.8 | 102.908653422326 | -3.10865342232592 |
| 54 | 116.8 | 116.868645129306 | -0.068645129305859 |
| 55 | 115.7 | 116.587696701845 | -0.887696701844936 |
| 56 | 99.4 | 105.008253848616 | -5.60825384861605 |
| 57 | 94.3 | 97.5175813878073 | -3.21758138780731 |
| 58 | 91 | 93.9044848683406 | -2.90448486834056 |
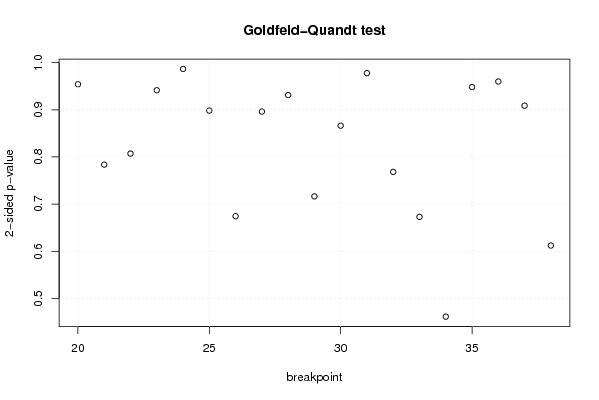
| Goldfeld-Quandt test for Heteroskedasticity | |||
| p-values | Alternative Hypothesis | ||
| breakpoint index | greater | 2-sided | less |
| 20 | 0.477011089876752 | 0.954022179753505 | 0.522988910123248 |
| 21 | 0.391852030106857 | 0.783704060213714 | 0.608147969893143 |
| 22 | 0.403529733471464 | 0.80705946694293 | 0.596470266528536 |
| 23 | 0.529361960994027 | 0.941276078011945 | 0.470638039005973 |
| 24 | 0.493239014134886 | 0.986478028269773 | 0.506760985865114 |
| 25 | 0.550895480505404 | 0.898209038989192 | 0.449104519494596 |
| 26 | 0.662803395840522 | 0.674393208318956 | 0.337196604159478 |
| 27 | 0.551917527646938 | 0.896164944706124 | 0.448082472353062 |
| 28 | 0.534424508801414 | 0.931150982397173 | 0.465575491198586 |
| 29 | 0.641793178816782 | 0.716413642366436 | 0.358206821183218 |
| 30 | 0.566883170184653 | 0.866233659630695 | 0.433116829815347 |
| 31 | 0.488791013906447 | 0.977582027812893 | 0.511208986093553 |
| 32 | 0.384157120656949 | 0.768314241313899 | 0.615842879343051 |
| 33 | 0.336507634533565 | 0.67301526906713 | 0.663492365466435 |
| 34 | 0.230738459258926 | 0.461476918517851 | 0.769261540741074 |
| 35 | 0.525969182863191 | 0.948061634273618 | 0.474030817136809 |
| 36 | 0.479927943045405 | 0.95985588609081 | 0.520072056954595 |
| 37 | 0.454302885873803 | 0.908605771747605 | 0.545697114126197 |
| 38 | 0.306101719851925 | 0.612203439703850 | 0.693898280148075 |
| Meta Analysis of Goldfeld-Quandt test for Heteroskedasticity | |||
| Description | # significant tests | % significant tests | OK/NOK |
| 1% type I error level | 0 | 0 | OK |
| 5% type I error level | 0 | 0 | OK |
| 10% type I error level | 0 | 0 | OK |