| Multiple Linear Regression - Estimated Regression Equation |
| Werkloosheid[t] = + 249.415186059235 -1.92948389941011Productie[t] + 41.0931629464141M1[t] + 29.0656105865259M2[t] + 35.6398262018006M3[t] + 15.7845988530270M4[t] + 20.1315073664078M5[t] + 38.6281450371932M6[t] -30.2991618876123M7[t] + 34.0745732684258M8[t] + 39.8599385969573M9[t] + 46.9544097040668M10[t] + 39.9495451253646M11[t] + e[t] |
| Multiple Linear Regression - Ordinary Least Squares | |||||
| Variable | Parameter | S.D. | T-STAT H0: parameter = 0 | 2-tail p-value | 1-tail p-value |
| (Intercept) | 249.415186059235 | 21.071473 | 11.8366 | 0 | 0 |
| Productie | -1.92948389941011 | 0.202925 | -9.5084 | 0 | 0 |
| M1 | 41.0931629464141 | 8.803387 | 4.6679 | 2.6e-05 | 1.3e-05 |
| M2 | 29.0656105865259 | 8.616018 | 3.3734 | 0.001495 | 0.000747 |
| M3 | 35.6398262018006 | 8.868238 | 4.0188 | 0.00021 | 0.000105 |
| M4 | 15.7845988530270 | 8.469683 | 1.8637 | 0.068624 | 0.034312 |
| M5 | 20.1315073664078 | 8.624979 | 2.3341 | 0.023917 | 0.011958 |
| M6 | 38.6281450371932 | 9.192931 | 4.2019 | 0.000117 | 5.9e-05 |
| M7 | -30.2991618876123 | 9.42599 | -3.2144 | 0.002364 | 0.001182 |
| M8 | 34.0745732684258 | 8.802185 | 3.8711 | 0.000333 | 0.000167 |
| M9 | 39.8599385969573 | 9.226055 | 4.3204 | 8e-05 | 4e-05 |
| M10 | 46.9544097040668 | 9.677977 | 4.8517 | 1.4e-05 | 7e-06 |
| M11 | 39.9495451253646 | 9.464826 | 4.2208 | 0.00011 | 5.5e-05 |
| Multiple Linear Regression - Regression Statistics | |
| Multiple R | 0.82371411150098 |
| R-squared | 0.678504937485848 |
| Adjusted R-squared | 0.596421091737554 |
| F-TEST (value) | 8.2659983983505 |
| F-TEST (DF numerator) | 12 |
| F-TEST (DF denominator) | 47 |
| p-value | 4.50185317912855e-08 |
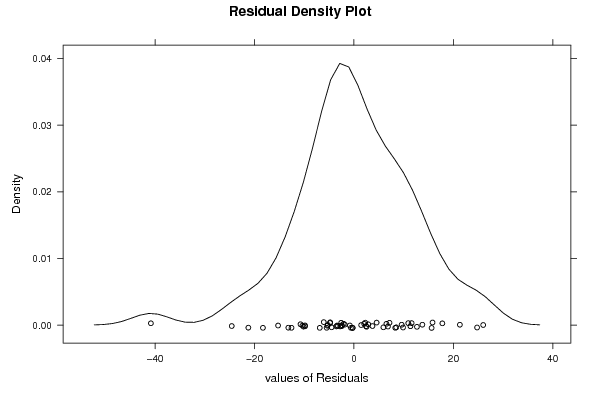
| Multiple Linear Regression - Residual Statistics | |
| Residual Standard Deviation | 13.2937513016362 |
| Sum Squared Residuals | 8306.01971247849 |
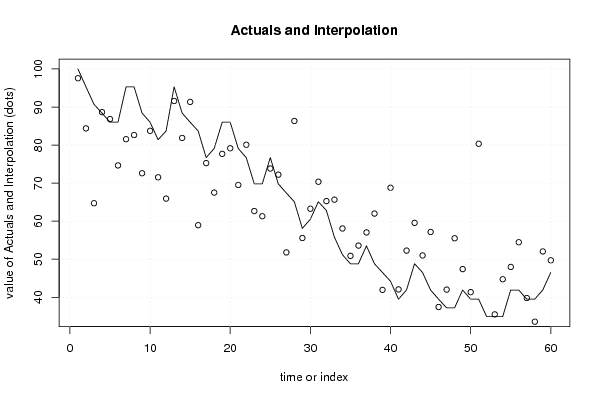
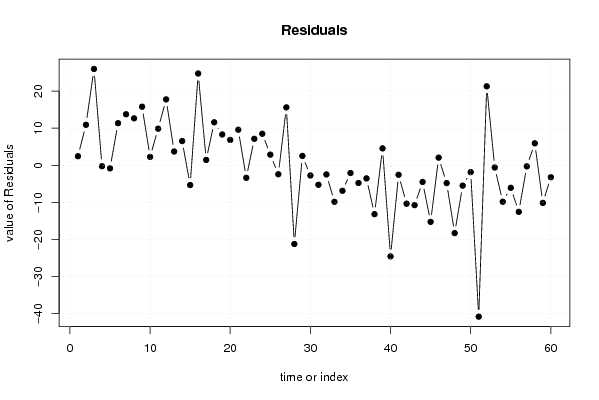
| Multiple Linear Regression - Actuals, Interpolation, and Residuals | |||
| Time or Index | Actuals | Interpolation Forecast | Residuals Prediction Error |
| 1 | 100 | 97.559959064638 | 2.44004093536208 |
| 2 | 95.3 | 84.3747163651038 | 10.9252836348962 |
| 3 | 90.7 | 64.7079509484011 | 25.9920490515989 |
| 4 | 88.4 | 88.652008116237 | -0.252008116237041 |
| 5 | 86 | 86.8245681515056 | -0.824568151505607 |
| 6 | 86 | 74.6424118216702 | 11.3575881783298 |
| 7 | 95.3 | 81.543822143682 | 13.7561778563180 |
| 8 | 95.3 | 82.6304853990685 | 12.6695146009315 |
| 9 | 88.4 | 72.5940827524371 | 15.8059172475629 |
| 10 | 86 | 83.7404700483078 | 2.25952995169217 |
| 11 | 81.4 | 71.5259989411983 | 9.8740010588017 |
| 12 | 83.7 | 65.9212672253337 | 17.7787327746663 |
| 13 | 95.3 | 91.5785589764669 | 3.7214410235331 |
| 14 | 88.4 | 81.8663872958708 | 6.5336127041292 |
| 15 | 86 | 91.3348287602606 | -5.33482876026065 |
| 16 | 83.7 | 58.9379560653214 | 24.7620439346786 |
| 17 | 76.7 | 75.2476647550449 | 1.45233524495508 |
| 18 | 79.1 | 67.5033213938528 | 11.5966786061472 |
| 19 | 86 | 77.6848543448618 | 8.31514565513822 |
| 20 | 86 | 79.1574143801303 | 6.84258561986969 |
| 21 | 79.1 | 69.5069085133809 | 9.59309148661911 |
| 22 | 76.7 | 80.0744506394286 | -3.37445063942863 |
| 23 | 69.8 | 62.6503730039118 | 7.14962699608822 |
| 24 | 69.8 | 61.2905058667494 | 8.50949413325055 |
| 25 | 76.7 | 73.8273071018939 | 2.87269289810612 |
| 26 | 69.8 | 72.2189677988202 | -2.41896779882024 |
| 27 | 67.4 | 51.7804088223534 | 15.6195911776466 |
| 28 | 65.1 | 86.336627436945 | -21.2366274369449 |
| 29 | 58.1 | 55.5669289810618 | 2.53307101893821 |
| 30 | 60.5 | 63.2584568151505 | -2.75845681515055 |
| 31 | 65.1 | 70.3528155271034 | -5.25281552710338 |
| 32 | 62.8 | 65.2651303043775 | -2.46513030437754 |
| 33 | 55.8 | 65.6479407145607 | -9.84794071456066 |
| 34 | 51.2 | 58.0783341861534 | -6.87833418615335 |
| 35 | 48.8 | 50.8805212175101 | -2.08052121751012 |
| 36 | 48.8 | 53.572570269109 | -4.772570269109 |
| 37 | 53.5 | 57.0407971770259 | -3.54079717702592 |
| 38 | 48.8 | 61.9927031319467 | -13.1927031319467 |
| 39 | 46.5 | 41.9400409353618 | 4.55995906463816 |
| 40 | 44.2 | 68.7783239523129 | -24.5783239523129 |
| 41 | 39.5 | 42.060541685191 | -2.56054168519102 |
| 42 | 41.9 | 52.2603985885129 | -10.3603985885129 |
| 43 | 48.8 | 59.5477056904067 | -10.7477056904067 |
| 44 | 46.5 | 50.9869494487427 | -4.48694944874272 |
| 45 | 41.9 | 57.1582115571562 | -15.2582115571562 |
| 46 | 39.5 | 37.4328564624652 | 2.06714353753480 |
| 47 | 37.2 | 42.0048952802236 | -4.80489528022362 |
| 48 | 37.2 | 55.5020541685191 | -18.3020541685191 |
| 49 | 41.9 | 47.3933776799754 | -5.49337767997538 |
| 50 | 39.5 | 41.3472254082585 | -1.84722540825847 |
| 51 | 39.5 | 80.336770533623 | -40.8367705336230 |
| 52 | 34.9 | 13.5950844291838 | 21.3049155708162 |
| 53 | 34.9 | 35.5002964271967 | -0.600296427196659 |
| 54 | 34.9 | 44.7354113808135 | -9.8354113808135 |
| 55 | 41.9 | 47.9708022939461 | -6.07080229394606 |
| 56 | 41.9 | 54.4600204676809 | -12.5600204676809 |
| 57 | 39.5 | 39.7928564624652 | -0.292856462465183 |
| 58 | 39.5 | 33.573888663645 | 5.92611133635502 |
| 59 | 41.9 | 52.0382115571562 | -10.1382115571562 |
| 60 | 46.5 | 49.7136024702888 | -3.21360247028878 |
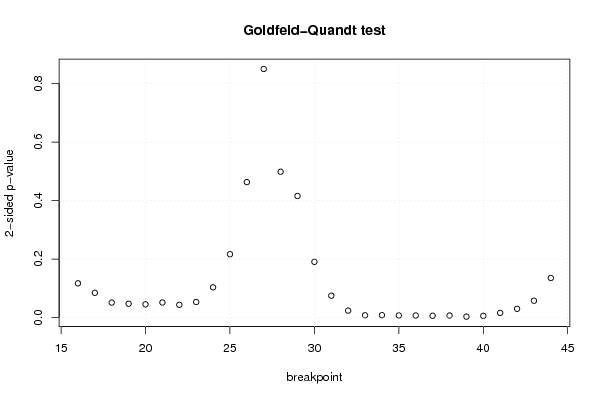
| Goldfeld-Quandt test for Heteroskedasticity | |||
| p-values | Alternative Hypothesis | ||
| breakpoint index | greater | 2-sided | less |
| 16 | 0.0584433403247081 | 0.116886680649416 | 0.941556659675292 |
| 17 | 0.0421979965735385 | 0.084395993147077 | 0.957802003426461 |
| 18 | 0.0255127887464208 | 0.0510255774928416 | 0.97448721125358 |
| 19 | 0.0235144621849613 | 0.0470289243699226 | 0.976485537815039 |
| 20 | 0.0225423710621117 | 0.0450847421242235 | 0.977457628937888 |
| 21 | 0.0255877984721921 | 0.0511755969443841 | 0.974412201527808 |
| 22 | 0.0216448225276121 | 0.0432896450552242 | 0.978355177472388 |
| 23 | 0.0265045083702326 | 0.0530090167404651 | 0.973495491629767 |
| 24 | 0.0515754294011004 | 0.103150858802201 | 0.9484245705989 |
| 25 | 0.108168886066352 | 0.216337772132704 | 0.891831113933648 |
| 26 | 0.231538677925017 | 0.463077355850034 | 0.768461322074983 |
| 27 | 0.424992547712422 | 0.849985095424845 | 0.575007452287578 |
| 28 | 0.750739776924384 | 0.498520446151233 | 0.249260223075616 |
| 29 | 0.792232375883454 | 0.415535248233092 | 0.207767624116546 |
| 30 | 0.904799737380532 | 0.190400525238936 | 0.0952002626194682 |
| 31 | 0.96273313279414 | 0.0745337344117202 | 0.0372668672058601 |
| 32 | 0.988224135490755 | 0.0235517290184899 | 0.0117758645092449 |
| 33 | 0.996232585941848 | 0.00753482811630418 | 0.00376741405815209 |
| 34 | 0.996044557931862 | 0.00791088413627593 | 0.00395544206813797 |
| 35 | 0.996487885101533 | 0.00702422979693382 | 0.00351211489846691 |
| 36 | 0.996540108862986 | 0.00691978227402782 | 0.00345989113701391 |
| 37 | 0.997000690087874 | 0.0059986198242519 | 0.00299930991212595 |
| 38 | 0.996669184282144 | 0.00666163143571117 | 0.00333081571785559 |
| 39 | 0.998561720454548 | 0.00287655909090423 | 0.00143827954545211 |
| 40 | 0.997217459818329 | 0.00556508036334284 | 0.00278254018167142 |
| 41 | 0.992065942734206 | 0.0158681145315875 | 0.00793405726579374 |
| 42 | 0.985165292624985 | 0.0296694147500301 | 0.0148347073750150 |
| 43 | 0.971314576684839 | 0.0573708466303228 | 0.0286854233151614 |
| 44 | 0.93246646893748 | 0.135067062125039 | 0.0675335310625194 |
| Meta Analysis of Goldfeld-Quandt test for Heteroskedasticity | |||
| Description | # significant tests | % significant tests | OK/NOK |
| 1% type I error level | 8 | 0.275862068965517 | NOK |
| 5% type I error level | 14 | 0.482758620689655 | NOK |
| 10% type I error level | 20 | 0.689655172413793 | NOK |