| Multiple Linear Regression - Estimated Regression Equation |
| Werkloosheid[t] = + 122.578682792808 -0.282440508201765Productie[t] + 8.53269735149619M1[t] + 3.43605920340464M2[t] + 3.43543322256755M3[t] -0.79249080882931M4[t] -2.72395608114270M5[t] + 2.24731688263167M6[t] -0.883745028590917M7[t] + 8.78854064022755M8[t] + 5.9237896997247M9[t] + 5.98224706118411M10[t] + 3.63537681441102M11[t] -1.03449887127078t + e[t] |
| Multiple Linear Regression - Ordinary Least Squares | |||||
| Variable | Parameter | S.D. | T-STAT H0: parameter = 0 | 2-tail p-value | 1-tail p-value |
| (Intercept) | 122.578682792808 | 12.40093 | 9.8846 | 0 | 0 |
| Productie | -0.282440508201765 | 0.141067 | -2.0022 | 0.051183 | 0.025591 |
| M1 | 8.53269735149619 | 4.332484 | 1.9695 | 0.054939 | 0.027469 |
| M2 | 3.43605920340464 | 4.040241 | 0.8505 | 0.399475 | 0.199738 |
| M3 | 3.43543322256755 | 4.343856 | 0.7909 | 0.433078 | 0.216539 |
| M4 | -0.79249080882931 | 3.756521 | -0.211 | 0.833847 | 0.416924 |
| M5 | -2.72395608114270 | 3.966113 | -0.6868 | 0.495652 | 0.247826 |
| M6 | 2.24731688263167 | 4.608881 | 0.4876 | 0.628145 | 0.314073 |
| M7 | -0.883745028590917 | 4.461179 | -0.1981 | 0.843842 | 0.421921 |
| M8 | 8.78854064022755 | 4.101621 | 2.1427 | 0.037462 | 0.018731 |
| M9 | 5.9237896997247 | 4.533997 | 1.3065 | 0.197868 | 0.098934 |
| M10 | 5.98224706118411 | 4.951828 | 1.2081 | 0.233188 | 0.116594 |
| M11 | 3.63537681441102 | 4.703997 | 0.7728 | 0.443578 | 0.221789 |
| t | -1.03449887127078 | 0.070302 | -14.7151 | 0 | 0 |
| Multiple Linear Regression - Regression Statistics | |
| Multiple R | 0.971426418637605 |
| R-squared | 0.943669286827083 |
| Adjusted R-squared | 0.927749737452129 |
| F-TEST (value) | 59.2773868531544 |
| F-TEST (DF numerator) | 13 |
| F-TEST (DF denominator) | 46 |
| p-value | 0 |
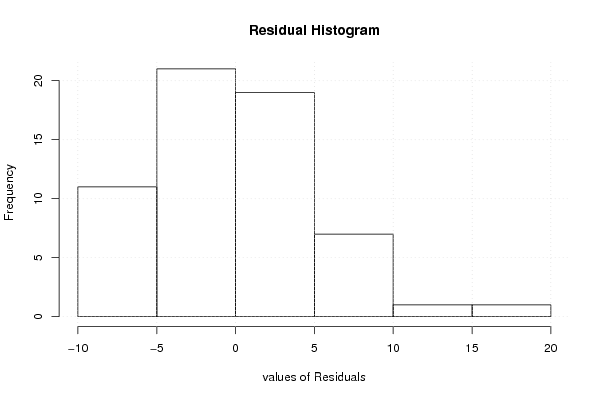
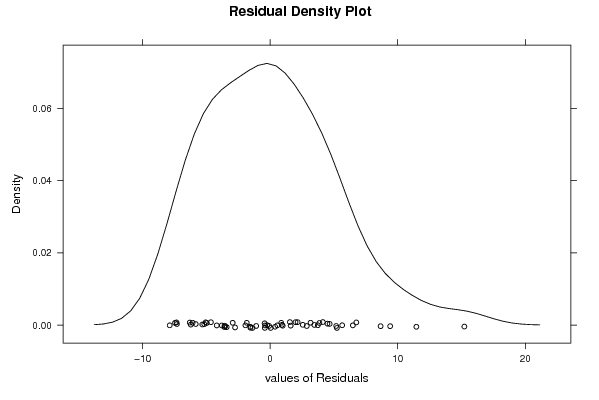
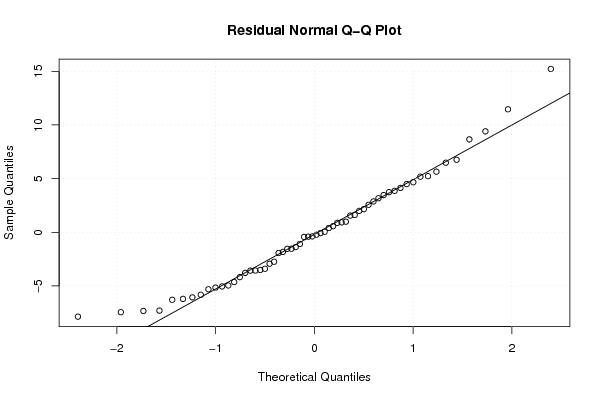
| Multiple Linear Regression - Residual Statistics | |
| Residual Standard Deviation | 5.62474753413341 |
| Sum Squared Residuals | 1455.33810184603 |
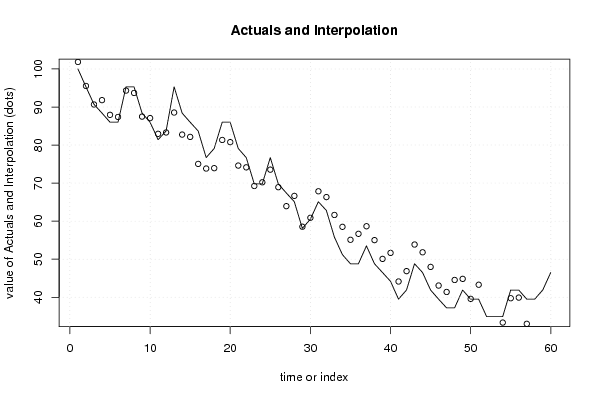
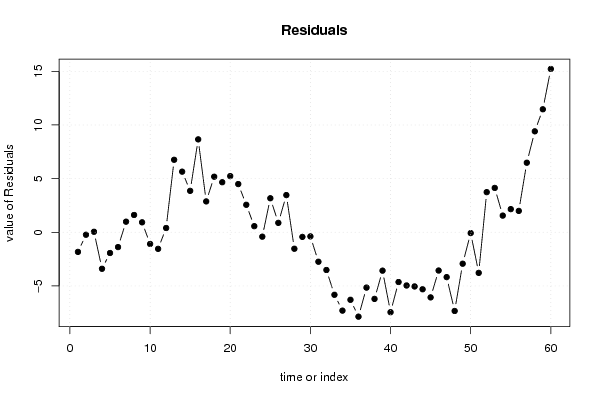
| Multiple Linear Regression - Actuals, Interpolation, and Residuals | |||
| Time or Index | Actuals | Interpolation Forecast | Residuals Prediction Error |
| 1 | 100 | 101.832830452856 | -1.83283045285648 |
| 2 | 95.3 | 95.5322291285732 | -0.232229128573165 |
| 3 | 90.7 | 90.6559133649214 | 0.0440866350786144 |
| 4 | 88.4 | 91.8048899984338 | -3.40488999843381 |
| 5 | 86 | 87.935116228604 | -1.93511622860400 |
| 6 | 86 | 87.3810862406995 | -1.38108624069954 |
| 7 | 95.3 | 94.3154374305355 | 0.984562569464472 |
| 8 | 95.3 | 93.6891755590654 | 1.61082444093464 |
| 9 | 88.4 | 87.4739135800373 | 0.926086419962743 |
| 10 | 86 | 87.0909971374496 | -1.09099713744960 |
| 11 | 81.4 | 82.947038647261 | -1.54703864726096 |
| 12 | 83.7 | 83.3046040075706 | 0.395395992429427 |
| 13 | 95.3 | 88.5432784221819 | 6.75672157781813 |
| 14 | 88.4 | 82.7510700126617 | 5.64892998733833 |
| 15 | 86 | 82.1396059228564 | 3.86039407714355 |
| 16 | 83.7 | 75.0413197168774 | 8.65868028312265 |
| 17 | 76.7 | 73.8264867241441 | 2.87351327585588 |
| 18 | 79.1 | 73.9220699051037 | 5.17793009489627 |
| 19 | 86 | 81.3365699588827 | 4.66343004111732 |
| 20 | 86 | 80.7667961890529 | 5.23320381094713 |
| 21 | 79.1 | 74.6080223116651 | 4.49197768833486 |
| 22 | 76.7 | 74.140373716617 | 2.55962628338305 |
| 23 | 69.8 | 69.2338258542836 | 0.566174145716451 |
| 24 | 69.8 | 70.212760332637 | -0.412760332637047 |
| 25 | 76.7 | 73.5308392914764 | 3.16916070852364 |
| 26 | 69.8 | 68.9248810164035 | 0.87511898359645 |
| 27 | 67.4 | 63.935589049471 | 3.46441095052902 |
| 28 | 65.1 | 66.6379884780931 | -1.53798847809310 |
| 29 | 58.1 | 58.5316070852368 | -0.431607085236823 |
| 30 | 60.5 | 60.8867143318105 | -0.386714331810541 |
| 31 | 65.1 | 67.8493095724667 | -2.74930957246669 |
| 32 | 62.8 | 66.3192380747509 | -3.51923807475087 |
| 33 | 55.8 | 61.6291548400123 | -5.8291548400123 |
| 34 | 51.2 | 58.5065654678675 | -7.30656546786754 |
| 35 | 48.8 | 55.0969522990035 | -6.29695229900349 |
| 36 | 48.8 | 56.6690118445807 | -7.86901184458068 |
| 37 | 53.5 | 58.6596204148717 | -5.15962041487171 |
| 38 | 48.8 | 55.0139598676849 | -6.2139598676849 |
| 39 | 46.5 | 50.0811560023927 | -3.58115600239269 |
| 40 | 44.2 | 51.6537933982077 | -7.45379339820773 |
| 41 | 39.5 | 44.1405370725752 | -4.64053707257518 |
| 42 | 41.9 | 46.8628169798112 | -4.96281697981119 |
| 43 | 48.8 | 53.8536562712875 | -5.0536562712875 |
| 44 | 46.5 | 51.8151918588085 | -5.31519185880851 |
| 45 | 41.9 | 47.9724301486752 | -6.07243014867524 |
| 46 | 39.5 | 43.0704655748594 | -3.57046557485937 |
| 47 | 37.2 | 41.3837395060261 | -4.18373950602606 |
| 48 | 37.2 | 44.5374658975332 | -7.33746589753315 |
| 49 | 41.9 | 44.8334314186136 | -2.93343141861359 |
| 50 | 39.5 | 39.5778599746767 | -0.0778599746767222 |
| 51 | 39.5 | 43.2877356603585 | -3.78773566035850 |
| 52 | 34.9 | 31.162008408388 | 3.737991591612 |
| 53 | 34.9 | 30.7662528894399 | 4.13374711056012 |
| 54 | 34.9 | 33.347312542575 | 1.55268745742499 |
| 55 | 41.9 | 39.7450267668276 | 2.15497323317240 |
| 56 | 41.9 | 39.9095983183224 | 1.99040168167761 |
| 57 | 39.5 | 33.0164791196101 | 6.48352088038994 |
| 58 | 39.5 | 30.0915981032065 | 9.40840189679346 |
| 59 | 41.9 | 30.4384436934259 | 11.4615563065741 |
| 60 | 46.5 | 31.2761579176786 | 15.2238420823214 |
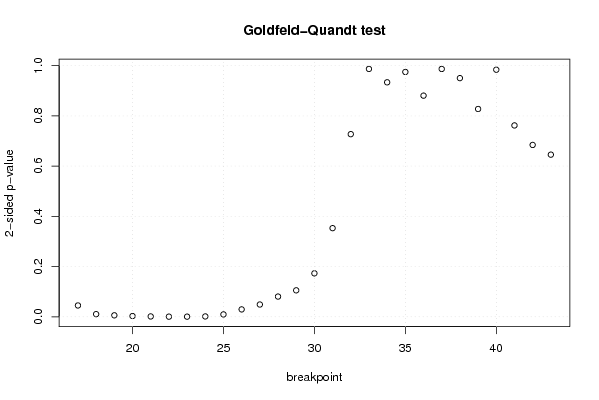
| Goldfeld-Quandt test for Heteroskedasticity | |||
| p-values | Alternative Hypothesis | ||
| breakpoint index | greater | 2-sided | less |
| 17 | 0.0225939755667750 | 0.0451879511335499 | 0.977406024433225 |
| 18 | 0.00528927355010481 | 0.0105785471002096 | 0.994710726449895 |
| 19 | 0.00295188955602626 | 0.00590377911205251 | 0.997048110443974 |
| 20 | 0.00148356296112436 | 0.00296712592224872 | 0.998516437038876 |
| 21 | 0.000706830307742383 | 0.00141366061548477 | 0.999293169692258 |
| 22 | 0.000291744693991266 | 0.000583489387982532 | 0.99970825530601 |
| 23 | 0.000288759339290264 | 0.000577518678580528 | 0.99971124066071 |
| 24 | 0.000710136553411108 | 0.00142027310682222 | 0.999289863446589 |
| 25 | 0.00475837053817052 | 0.00951674107634104 | 0.99524162946183 |
| 26 | 0.0147525736211144 | 0.0295051472422289 | 0.985247426378886 |
| 27 | 0.0244674943428643 | 0.0489349886857286 | 0.975532505657136 |
| 28 | 0.0403010167088986 | 0.0806020334177972 | 0.959698983291101 |
| 29 | 0.0527062857576043 | 0.105412571515209 | 0.947293714242396 |
| 30 | 0.086549809116371 | 0.173099618232742 | 0.913450190883629 |
| 31 | 0.176487414791029 | 0.352974829582059 | 0.82351258520897 |
| 32 | 0.363647145206618 | 0.727294290413236 | 0.636352854793382 |
| 33 | 0.493483456328786 | 0.986966912657571 | 0.506516543671214 |
| 34 | 0.53312302277294 | 0.93375395445412 | 0.46687697722706 |
| 35 | 0.487478068819239 | 0.974956137638478 | 0.512521931180761 |
| 36 | 0.440327768163693 | 0.880655536327386 | 0.559672231836307 |
| 37 | 0.493463531920419 | 0.986927063840837 | 0.506536468079581 |
| 38 | 0.475226404430385 | 0.95045280886077 | 0.524773595569615 |
| 39 | 0.586243221366837 | 0.827513557266326 | 0.413756778633163 |
| 40 | 0.491971250204012 | 0.983942500408023 | 0.508028749795988 |
| 41 | 0.381044928958924 | 0.762089857917847 | 0.618955071041076 |
| 42 | 0.34219501301204 | 0.68439002602408 | 0.65780498698796 |
| 43 | 0.322834767689665 | 0.64566953537933 | 0.677165232310335 |
| Meta Analysis of Goldfeld-Quandt test for Heteroskedasticity | |||
| Description | # significant tests | % significant tests | OK/NOK |
| 1% type I error level | 7 | 0.259259259259259 | NOK |
| 5% type I error level | 11 | 0.407407407407407 | NOK |
| 10% type I error level | 12 | 0.444444444444444 | NOK |