| Multiple Linear Regression - Estimated Regression Equation |
| Y[t] = + 4956.68494757646 -0.0944174386294636X[t] -206.665378833773M1[t] -162.867354864276M2[t] -63.2297797597224M3[t] + 43.2200006714761M4[t] -17.5093311952292M5[t] + 80.4289009723294M6[t] + 113.359632514790M7[t] -36.0877919874512M8[t] -73.0366645904004M9[t] -65.9604239235216M10[t] + 20.7673994902416M11[t] + e[t] |
| Multiple Linear Regression - Ordinary Least Squares | |||||
| Variable | Parameter | S.D. | T-STAT H0: parameter = 0 | 2-tail p-value | 1-tail p-value |
| (Intercept) | 4956.68494757646 | 668.029121 | 7.4199 | 0 | 0 |
| X | -0.0944174386294636 | 0.031208 | -3.0255 | 0.004017 | 0.002009 |
| M1 | -206.665378833773 | 555.538543 | -0.372 | 0.711558 | 0.355779 |
| M2 | -162.867354864276 | 555.04636 | -0.2934 | 0.770485 | 0.385243 |
| M3 | -63.2297797597224 | 553.027403 | -0.1143 | 0.90946 | 0.45473 |
| M4 | 43.2200006714761 | 551.771414 | 0.0783 | 0.937898 | 0.468949 |
| M5 | -17.5093311952292 | 551.917498 | -0.0317 | 0.974826 | 0.487413 |
| M6 | 80.4289009723294 | 552.176089 | 0.1457 | 0.884814 | 0.442407 |
| M7 | 113.359632514790 | 551.981421 | 0.2054 | 0.838171 | 0.419086 |
| M8 | -36.0877919874512 | 552.411094 | -0.0653 | 0.94819 | 0.474095 |
| M9 | -73.0366645904004 | 552.094385 | -0.1323 | 0.89532 | 0.44766 |
| M10 | -65.9604239235216 | 552.374595 | -0.1194 | 0.905458 | 0.452729 |
| M11 | 20.7673994902416 | 551.981025 | 0.0376 | 0.970147 | 0.485074 |
| Multiple Linear Regression - Regression Statistics | |
| Multiple R | 0.408125227374325 |
| R-squared | 0.166566201219344 |
| Adjusted R-squared | -0.0462254069799719 |
| F-TEST (value) | 0.782766776513697 |
| F-TEST (DF numerator) | 12 |
| F-TEST (DF denominator) | 47 |
| p-value | 0.664948367821439 |
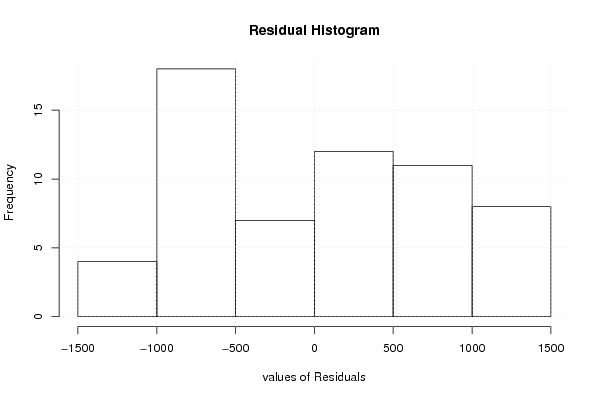
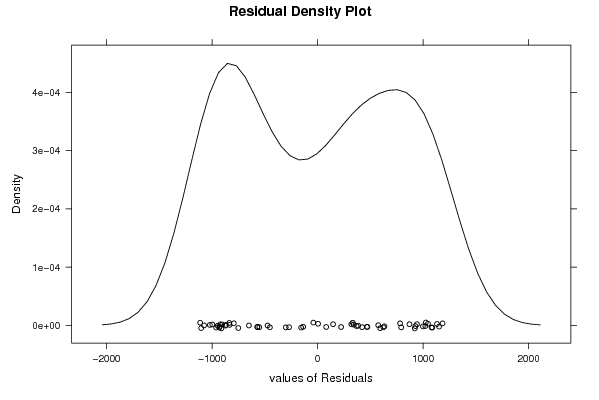
| Multiple Linear Regression - Residual Statistics | |
| Residual Standard Deviation | 872.31795811634 |
| Sum Squared Residuals | 35764115.1424563 |
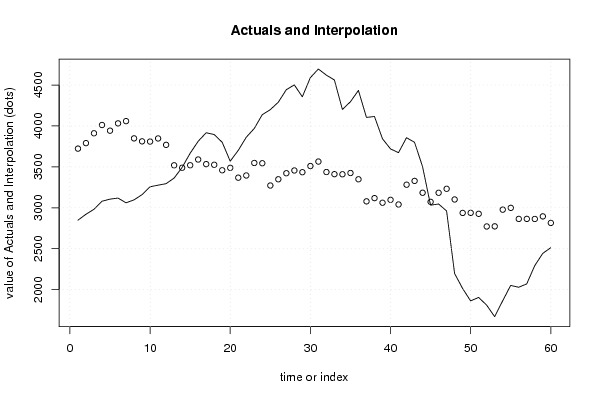
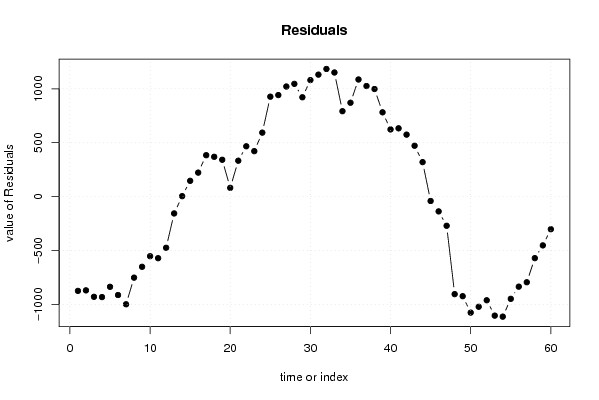
| Multiple Linear Regression - Actuals, Interpolation, and Residuals | |||
| Time or Index | Actuals | Interpolation Forecast | Residuals Prediction Error |
| 1 | 2849.27 | 3723.51317596317 | -874.24317596317 |
| 2 | 2921.44 | 3790.63230727414 | -869.192307274135 |
| 3 | 2981.85 | 3910.85288399991 | -929.002883999913 |
| 4 | 3080.58 | 4012.01528786786 | -931.435287867861 |
| 5 | 3106.22 | 3942.50513420862 | -836.285134208616 |
| 6 | 3119.31 | 4031.94579689952 | -912.635796899523 |
| 7 | 3061.26 | 4059.58915187873 | -998.329151878732 |
| 8 | 3097.31 | 3848.67597482871 | -751.365974828712 |
| 9 | 3161.69 | 3812.38802429617 | -650.698024296168 |
| 10 | 3257.16 | 3809.55043390695 | -552.390433906953 |
| 11 | 3277.01 | 3847.8421113038 | -570.832111303802 |
| 12 | 3295.32 | 3769.48007424959 | -474.160074249587 |
| 13 | 3363.99 | 3519.66592596215 | -155.675925962150 |
| 14 | 3494.17 | 3489.72393036204 | 4.44606963796447 |
| 15 | 3667.03 | 3520.24794038982 | 146.782059610178 |
| 16 | 3813.06 | 3590.15817207142 | 222.901827928582 |
| 17 | 3917.96 | 3533.67762494304 | 384.282375056961 |
| 18 | 3895.51 | 3525.96274328423 | 369.547256715773 |
| 19 | 3801.06 | 3458.90540731809 | 342.154592681914 |
| 20 | 3570.12 | 3488.47344645731 | 81.646553542692 |
| 21 | 3701.61 | 3368.24839298317 | 333.361607016828 |
| 22 | 3862.27 | 3395.24671320087 | 467.023286799133 |
| 23 | 3970.1 | 3548.25557853251 | 421.844421467486 |
| 24 | 4138.52 | 3544.76657031146 | 593.753429688536 |
| 25 | 4199.75 | 3272.57548906884 | 927.174510931157 |
| 26 | 4290.89 | 3348.75869448825 | 942.131305511754 |
| 27 | 4443.91 | 3422.52589140833 | 1021.38410859167 |
| 28 | 4502.64 | 3456.36866153347 | 1046.27133846653 |
| 29 | 4356.98 | 3435.29465389114 | 921.685346108862 |
| 30 | 4591.27 | 3510.28944847174 | 1080.98055152826 |
| 31 | 4696.96 | 3565.31386065349 | 1131.64613934651 |
| 32 | 4621.4 | 3437.01594240425 | 1184.38405759575 |
| 33 | 4562.84 | 3411.30274499821 | 1151.53725500179 |
| 34 | 4202.52 | 3409.97583362706 | 792.544166372937 |
| 35 | 4296.49 | 3425.41849087558 | 871.071509124418 |
| 36 | 4435.23 | 3348.56713283944 | 1086.66286716056 |
| 37 | 4105.18 | 3079.2085747557 | 1025.97142524430 |
| 38 | 4116.68 | 3118.38014423236 | 998.299855767645 |
| 39 | 3844.49 | 3062.32336303692 | 782.166636963076 |
| 40 | 3720.98 | 3097.58239474151 | 623.397605258494 |
| 41 | 3674.4 | 3040.62976041998 | 633.77023958002 |
| 42 | 3857.62 | 3282.46016905884 | 575.159830941159 |
| 43 | 3801.06 | 3328.89259432531 | 472.167405674685 |
| 44 | 3504.37 | 3184.16604175455 | 320.203958245453 |
| 45 | 3032.6 | 3072.91064495021 | -40.3106449502098 |
| 46 | 3047.03 | 3183.75165067087 | -136.721650670869 |
| 47 | 2962.34 | 3232.33482887833 | -269.994828878329 |
| 48 | 2197.82 | 3101.94878313928 | -904.12878313928 |
| 49 | 2014.45 | 2937.67683425014 | -923.226834250136 |
| 50 | 1862.83 | 2938.51492364323 | -1075.68492364323 |
| 51 | 1905.41 | 2926.73992116501 | -1021.32992116501 |
| 52 | 1810.99 | 2772.12548378575 | -961.135483785746 |
| 53 | 1670.07 | 2773.52282653723 | -1103.45282653723 |
| 54 | 1864.44 | 2977.49184228567 | -1113.05184228567 |
| 55 | 2052.02 | 2999.65898582438 | -947.638985824375 |
| 56 | 2029.6 | 2864.46859455518 | -834.868594555183 |
| 57 | 2070.83 | 2864.72019277224 | -793.890192772243 |
| 58 | 2293.41 | 2863.86536859425 | -570.455368594246 |
| 59 | 2443.27 | 2895.35899040977 | -452.088990409773 |
| 60 | 2513.17 | 2815.29743946023 | -302.127439460229 |
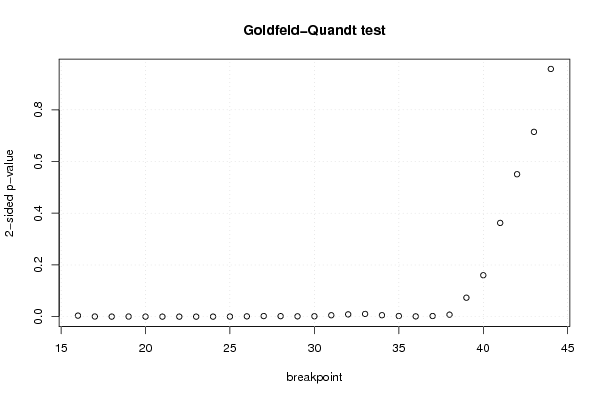
| Goldfeld-Quandt test for Heteroskedasticity | |||
| p-values | Alternative Hypothesis | ||
| breakpoint index | greater | 2-sided | less |
| 16 | 0.00197395535181374 | 0.00394791070362749 | 0.998026044648186 |
| 17 | 0.000250140115061029 | 0.000500280230122057 | 0.99974985988494 |
| 18 | 0.00010990212647081 | 0.00021980425294162 | 0.99989009787353 |
| 19 | 0.000212569208304142 | 0.000425138416608284 | 0.999787430791696 |
| 20 | 6.70559067973575e-05 | 0.000134111813594715 | 0.999932944093203 |
| 21 | 2.32788329008024e-05 | 4.65576658016047e-05 | 0.999976721167099 |
| 22 | 4.18621813678232e-06 | 8.37243627356463e-06 | 0.999995813781863 |
| 23 | 3.29587635284704e-06 | 6.59175270569408e-06 | 0.999996704123647 |
| 24 | 3.83749912654468e-05 | 7.67499825308936e-05 | 0.999961625008735 |
| 25 | 0.000188318403781130 | 0.000376636807562260 | 0.999811681596219 |
| 26 | 0.000581769720639734 | 0.00116353944127947 | 0.99941823027936 |
| 27 | 0.00112871274530795 | 0.00225742549061591 | 0.998871287254692 |
| 28 | 0.000960930114007974 | 0.00192186022801595 | 0.999039069885992 |
| 29 | 0.000659062635789068 | 0.00131812527157814 | 0.99934093736421 |
| 30 | 0.000763753109588089 | 0.00152750621917618 | 0.999236246890412 |
| 31 | 0.00271336344978438 | 0.00542672689956877 | 0.997286636550216 |
| 32 | 0.00443226280327115 | 0.0088645256065423 | 0.995567737196729 |
| 33 | 0.00522649422696856 | 0.0104529884539371 | 0.994773505773031 |
| 34 | 0.00280449855247827 | 0.00560899710495655 | 0.997195501447522 |
| 35 | 0.00128394277436240 | 0.00256788554872481 | 0.998716057225638 |
| 36 | 0.000554601979292821 | 0.00110920395858564 | 0.999445398020707 |
| 37 | 0.00118899912111138 | 0.00237799824222276 | 0.998811000878889 |
| 38 | 0.00378876169663109 | 0.00757752339326218 | 0.99621123830337 |
| 39 | 0.0366270788008075 | 0.073254157601615 | 0.963372921199192 |
| 40 | 0.0800925253974365 | 0.160185050794873 | 0.919907474602564 |
| 41 | 0.181242568564346 | 0.362485137128693 | 0.818757431435654 |
| 42 | 0.275425075448044 | 0.550850150896088 | 0.724574924551956 |
| 43 | 0.357318519744257 | 0.714637039488515 | 0.642681480255743 |
| 44 | 0.478991250033525 | 0.95798250006705 | 0.521008749966475 |
| Meta Analysis of Goldfeld-Quandt test for Heteroskedasticity | |||
| Description | # significant tests | % significant tests | OK/NOK |
| 1% type I error level | 22 | 0.758620689655172 | NOK |
| 5% type I error level | 23 | 0.793103448275862 | NOK |
| 10% type I error level | 24 | 0.827586206896552 | NOK |