| Multiple Linear Regression - Estimated Regression Equation |
| Werkloosheid(Y(t))[t] = + 2.85103732321234 + 0.976127794666543`Y(t-1)`[t] + 0.236365899150279`Y(t-2)`[t] + 0.134593358559729`Y(t-3)`[t] -0.341976205796012`Y(t-4)`[t] -0.0864265177172897Productie[t] + 2.5704281506859M1[t] + 8.0452757771165M2[t] + 10.6852562679373M3[t] + 5.13454323216124M4[t] -2.36138688814796M5[t] + 0.840375791480767M6[t] + 3.94041195459863M7[t] + 7.0899908939364M8[t] + 13.9240510104693M9[t] + 0.826377650593013M10[t] + 1.18103914539342M11[t] + 0.0648222506919648t + e[t] |
| Multiple Linear Regression - Ordinary Least Squares | |||||
| Variable | Parameter | S.D. | T-STAT H0: parameter = 0 | 2-tail p-value | 1-tail p-value |
| (Intercept) | 2.85103732321234 | 10.306593 | 0.2766 | 0.783569 | 0.391784 |
| `Y(t-1)` | 0.976127794666543 | 0.151884 | 6.4268 | 0 | 0 |
| `Y(t-2)` | 0.236365899150279 | 0.217164 | 1.0884 | 0.283264 | 0.141632 |
| `Y(t-3)` | 0.134593358559729 | 0.216229 | 0.6225 | 0.537359 | 0.268679 |
| `Y(t-4)` | -0.341976205796012 | 0.173163 | -1.9749 | 0.05558 | 0.02779 |
| Productie | -0.0864265177172897 | 0.055892 | -1.5463 | 0.130315 | 0.065158 |
| M1 | 2.5704281506859 | 2.406703 | 1.068 | 0.292246 | 0.146123 |
| M2 | 8.0452757771165 | 2.084308 | 3.8599 | 0.000427 | 0.000213 |
| M3 | 10.6852562679373 | 2.782161 | 3.8406 | 0.000452 | 0.000226 |
| M4 | 5.13454323216124 | 2.873556 | 1.7868 | 0.081945 | 0.040973 |
| M5 | -2.36138688814796 | 2.513384 | -0.9395 | 0.353395 | 0.176698 |
| M6 | 0.840375791480767 | 1.792159 | 0.4689 | 0.641807 | 0.320904 |
| M7 | 3.94041195459863 | 2.04567 | 1.9262 | 0.061582 | 0.030791 |
| M8 | 7.0899908939364 | 2.597087 | 2.73 | 0.009546 | 0.004773 |
| M9 | 13.9240510104693 | 2.239463 | 6.2176 | 0 | 0 |
| M10 | 0.826377650593013 | 2.851568 | 0.2898 | 0.773547 | 0.386773 |
| M11 | 1.18103914539342 | 2.563276 | 0.4608 | 0.647601 | 0.323801 |
| t | 0.0648222506919648 | 0.095957 | 0.6755 | 0.503428 | 0.251714 |
| Multiple Linear Regression - Regression Statistics | |
| Multiple R | 0.99638054568302 |
| R-squared | 0.992774191815591 |
| Adjusted R-squared | 0.989541593417303 |
| F-TEST (value) | 307.113371194316 |
| F-TEST (DF numerator) | 17 |
| F-TEST (DF denominator) | 38 |
| p-value | 0 |
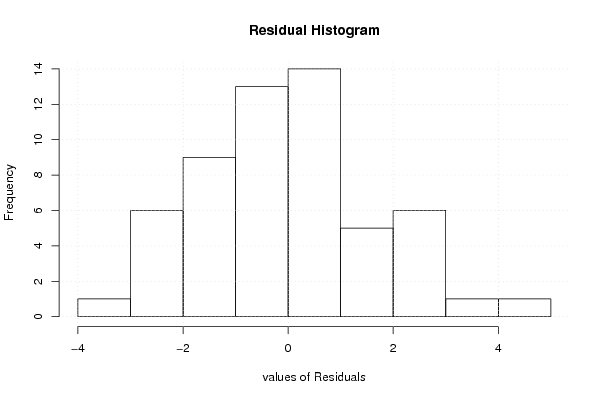
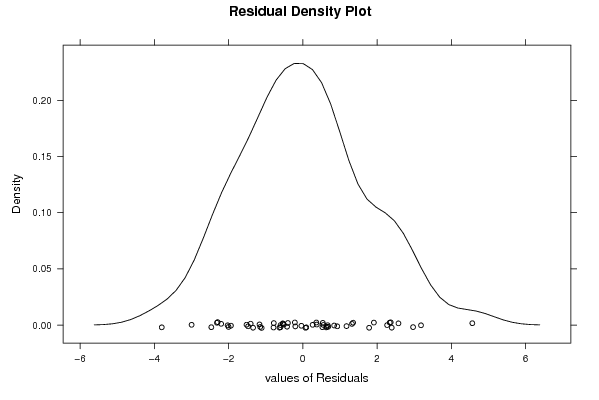
| Multiple Linear Regression - Residual Statistics | |
| Residual Standard Deviation | 2.03448320450095 |
| Sum Squared Residuals | 157.286632557065 |
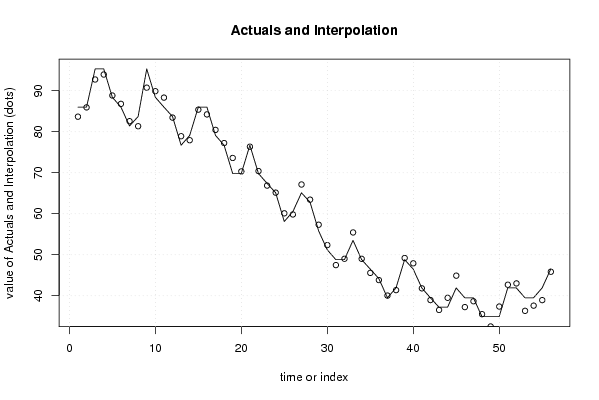
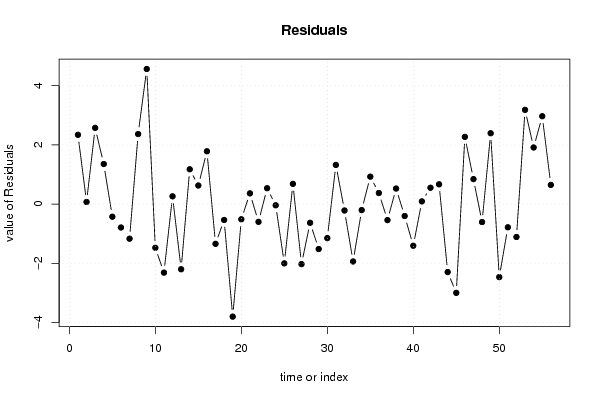
| Multiple Linear Regression - Actuals, Interpolation, and Residuals | |||
| Time or Index | Actuals | Interpolation Forecast | Residuals Prediction Error |
| 1 | 86 | 83.6589070893564 | 2.34109291064364 |
| 2 | 86 | 85.9262057773954 | 0.0737942226046428 |
| 3 | 95.3 | 92.7238183292111 | 2.57618167078890 |
| 4 | 95.3 | 93.9446474661863 | 1.35535253381374 |
| 5 | 88.4 | 88.8237879072953 | -0.423787907295282 |
| 6 | 86 | 86.7883049762286 | -0.788304976228623 |
| 7 | 81.4 | 82.5658016669622 | -1.16580166696223 |
| 8 | 83.7 | 81.3324346848708 | 2.36756531512918 |
| 9 | 95.3 | 90.7343274614483 | 4.56567253855169 |
| 10 | 88.4 | 89.8735256042379 | -1.47352560423791 |
| 11 | 86 | 88.3118670445993 | -2.31186704459934 |
| 12 | 83.7 | 83.4349840593609 | 0.265015940639098 |
| 13 | 76.7 | 78.8980886235964 | -2.19808862359638 |
| 14 | 79.1 | 77.9224334885015 | 1.17756651149850 |
| 15 | 86 | 85.3700470387939 | 0.629952961206113 |
| 16 | 86 | 84.2136034806987 | 1.78639651930127 |
| 17 | 79.1 | 80.4388656745955 | -1.33886567459555 |
| 18 | 76.7 | 77.2336878337599 | -0.533687833759903 |
| 19 | 69.8 | 73.5985758205673 | -3.79857582056726 |
| 20 | 69.8 | 70.3102532497208 | -0.510253249720842 |
| 21 | 76.7 | 76.3357102100421 | 0.364289789957942 |
| 22 | 69.8 | 70.3968927995785 | -0.596892799578531 |
| 23 | 67.4 | 66.8616840379591 | 0.538315962040915 |
| 24 | 65.1 | 65.1377577056107 | -0.0377577056107264 |
| 25 | 58.1 | 60.0993434047856 | -1.99934340478557 |
| 26 | 60.5 | 59.815100411429 | 0.684899588570984 |
| 27 | 65.1 | 67.1244315333738 | -2.02443153337376 |
| 28 | 62.8 | 63.4290438873068 | -0.629043887306756 |
| 29 | 55.8 | 57.3149884775548 | -1.51498847755478 |
| 30 | 51.2 | 52.346582297977 | -1.14658229797695 |
| 31 | 48.8 | 47.475393639148 | 1.32460636085203 |
| 32 | 48.8 | 49.0142227908515 | -0.214222790851544 |
| 33 | 53.5 | 55.435213895826 | -1.93521389582595 |
| 34 | 48.8 | 49.0007832636048 | -0.200783263604812 |
| 35 | 46.5 | 45.5714430495826 | 0.928556950417436 |
| 36 | 44.2 | 43.8233230151309 | 0.376676984869109 |
| 37 | 39.5 | 40.0384940330097 | -0.538494033009721 |
| 38 | 41.9 | 41.3728111235234 | 0.52718887647657 |
| 39 | 48.8 | 49.2002288447059 | -0.400228844705945 |
| 40 | 46.5 | 47.9039321191682 | -1.40393211916824 |
| 41 | 41.9 | 41.8062525572829 | 0.0937474427170518 |
| 42 | 39.5 | 38.9456307479733 | 0.554369252026719 |
| 43 | 37.2 | 36.529857880116 | 0.670142119884006 |
| 44 | 37.2 | 39.493317349177 | -2.29331734917701 |
| 45 | 41.9 | 44.8947484326837 | -2.99474843268369 |
| 46 | 39.5 | 37.2287983325787 | 2.27120166742125 |
| 47 | 39.5 | 38.655005867859 | 0.844994132140992 |
| 48 | 34.9 | 35.5039352198975 | -0.603935219897477 |
| 49 | 34.9 | 32.5051668492520 | 2.39483315074803 |
| 50 | 34.9 | 37.3634491991507 | -2.46344919915070 |
| 51 | 41.9 | 42.6814742539153 | -0.781474253915302 |
| 52 | 41.9 | 43.00877304664 | -1.10877304664000 |
| 53 | 39.5 | 36.3161053832714 | 3.18389461672855 |
| 54 | 39.5 | 37.5857941440612 | 1.91420585593875 |
| 55 | 41.9 | 38.9303709932065 | 2.96962900679346 |
| 56 | 46.5 | 45.8497719253798 | 0.650228074620219 |
| Goldfeld-Quandt test for Heteroskedasticity | |||
| p-values | Alternative Hypothesis | ||
| breakpoint index | greater | 2-sided | less |
| 21 | 0.511403350885411 | 0.977193298229179 | 0.488596649114589 |
| 22 | 0.344657621482333 | 0.689315242964666 | 0.655342378517667 |
| 23 | 0.841910465743089 | 0.316179068513823 | 0.158089534256911 |
| 24 | 0.749249662393189 | 0.501500675213622 | 0.250750337606811 |
| 25 | 0.707882230510599 | 0.584235538978803 | 0.292117769489401 |
| 26 | 0.645280988208059 | 0.709438023583883 | 0.354719011791941 |
| 27 | 0.579009633017837 | 0.841980733964325 | 0.420990366982163 |
| 28 | 0.495760638547543 | 0.991521277095086 | 0.504239361452457 |
| 29 | 0.432083966257842 | 0.864167932515684 | 0.567916033742158 |
| 30 | 0.492270091696039 | 0.984540183392078 | 0.507729908303961 |
| 31 | 0.582569273483456 | 0.834861453033089 | 0.417430726516544 |
| 32 | 0.447762107908364 | 0.895524215816728 | 0.552237892091636 |
| 33 | 0.401742253161213 | 0.803484506322425 | 0.598257746838787 |
| 34 | 0.410191879457695 | 0.82038375891539 | 0.589808120542305 |
| 35 | 0.303597315841075 | 0.60719463168215 | 0.696402684158925 |
| Meta Analysis of Goldfeld-Quandt test for Heteroskedasticity | |||
| Description | # significant tests | % significant tests | OK/NOK |
| 1% type I error level | 0 | 0 | OK |
| 5% type I error level | 0 | 0 | OK |
| 10% type I error level | 0 | 0 | OK |