| Multiple Linear Regression - Estimated Regression Equation |
| Werkloosheid(Y(t))[t] = + 11.5841647429370 + 1.04632041693899`Y(t-1)`[t] -0.0950668208423679Productie[t] -12.7609495083958M1[t] -9.424817754117M2[t] -10.6989575038838M3[t] -11.7292539613326M4[t] -5.15362859834418M5[t] -3.57859488699885M6[t] -8.66323485599034M7[t] -12.8218646585940M8[t] -9.01873321102618M9[t] -9.638801525644M10[t] -7.52752597007651M11[t] + 0.120237492740617t + e[t] |
| Multiple Linear Regression - Ordinary Least Squares | |||||
| Variable | Parameter | S.D. | T-STAT H0: parameter = 0 | 2-tail p-value | 1-tail p-value |
| (Intercept) | 11.5841647429370 | 8.681423 | 1.3344 | 0.18895 | 0.094475 |
| `Y(t-1)` | 1.04632041693899 | 0.059428 | 17.6066 | 0 | 0 |
| Productie | -0.0950668208423679 | 0.052115 | -1.8242 | 0.07492 | 0.03746 |
| M1 | -12.7609495083958 | 1.440477 | -8.8588 | 0 | 0 |
| M2 | -9.424817754117 | 1.377321 | -6.8429 | 0 | 0 |
| M3 | -10.6989575038838 | 1.448091 | -7.3883 | 0 | 0 |
| M4 | -11.7292539613326 | 1.389391 | -8.442 | 0 | 0 |
| M5 | -5.15362859834418 | 1.36825 | -3.7666 | 0.000488 | 0.000244 |
| M6 | -3.57859488699885 | 2.351778 | -1.5217 | 0.13525 | 0.067625 |
| M7 | -8.66323485599034 | 1.451651 | -5.9678 | 0 | 0 |
| M8 | -12.8218646585940 | 1.470832 | -8.7174 | 0 | 0 |
| M9 | -9.01873321102618 | 1.439944 | -6.2633 | 0 | 0 |
| M10 | -9.638801525644 | 1.395543 | -6.9068 | 0 | 0 |
| M11 | -7.52752597007651 | 1.641068 | -4.587 | 3.7e-05 | 1.9e-05 |
| t | 0.120237492740617 | 0.070396 | 1.708 | 0.09468 | 0.04734 |
| Multiple Linear Regression - Regression Statistics | |
| Multiple R | 0.996305173007122 |
| R-squared | 0.992623997760752 |
| Adjusted R-squared | 0.990277087957355 |
| F-TEST (value) | 422.949359333691 |
| F-TEST (DF numerator) | 14 |
| F-TEST (DF denominator) | 44 |
| p-value | 0 |
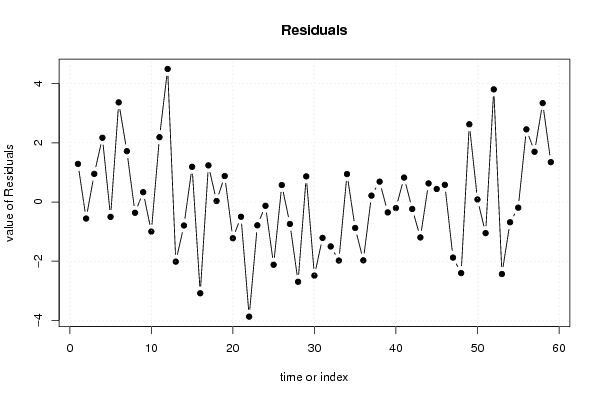
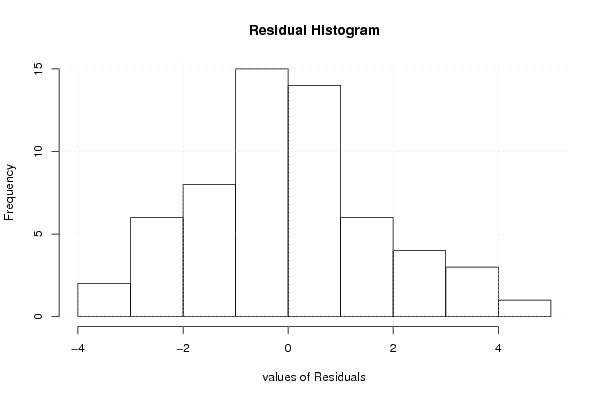
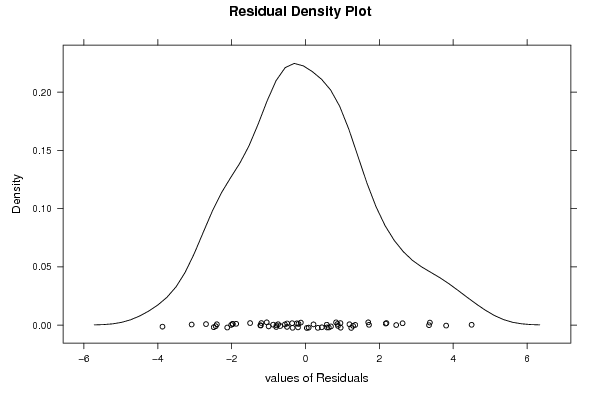
| Multiple Linear Regression - Residual Statistics | |
| Residual Standard Deviation | 2.02453928565169 |
| Sum Squared Residuals | 180.34541004247 |
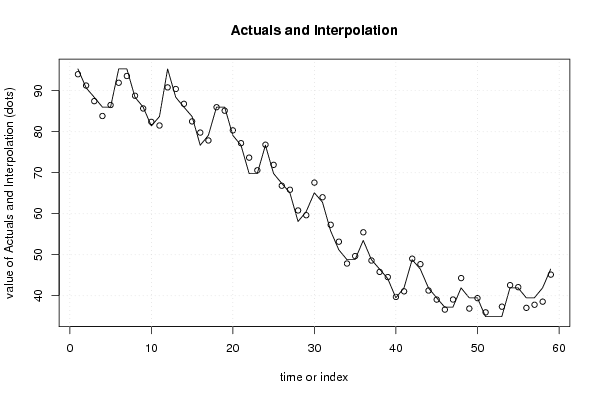
| Multiple Linear Regression - Actuals, Interpolation, and Residuals | |||
| Time or Index | Actuals | Interpolation Forecast | Residuals Prediction Error |
| 1 | 95.3 | 94.011772244439 | 1.28822775556099 |
| 2 | 90.7 | 91.2575267683888 | -0.557526768388819 |
| 3 | 88.4 | 87.4485674265651 | 0.951432573434919 |
| 4 | 86 | 83.8277576762016 | 2.17224232379843 |
| 5 | 86 | 86.5008890798834 | -0.500889079883405 |
| 6 | 95.3 | 91.9322863430744 | 3.36771365692559 |
| 7 | 95.3 | 93.5804720207265 | 1.71952797927350 |
| 8 | 88.4 | 88.762531779956 | -0.362531779956076 |
| 9 | 86 | 85.6659301671544 | 0.334069832845593 |
| 10 | 81.4 | 82.3982499283492 | -0.99824992834923 |
| 11 | 83.7 | 81.5088784697321 | 2.19112153026787 |
| 12 | 95.3 | 90.80264432477 | 4.49735567523001 |
| 13 | 88.4 | 90.413329330618 | -2.01332933061796 |
| 14 | 86 | 86.7926879320219 | -0.792687932021884 |
| 15 | 83.7 | 82.5096823388668 | 1.19031766113325 |
| 16 | 76.7 | 79.7825007044215 | -3.08250070442148 |
| 17 | 79.1 | 77.8612118781214 | 1.23878812187858 |
| 18 | 86 | 85.965391737398 | 0.0346082626019769 |
| 19 | 86 | 85.121421778565 | 0.878578221434994 |
| 20 | 79.1 | 80.322494901963 | -1.22249490196307 |
| 21 | 76.7 | 77.1973732429087 | -0.497373242908667 |
| 22 | 69.8 | 73.6730125878291 | -3.87301258782912 |
| 23 | 69.8 | 70.5862511761055 | -0.786251176105529 |
| 24 | 76.7 | 76.8270256904556 | -0.127025690455605 |
| 25 | 69.8 | 71.9192853842283 | -2.11928538422827 |
| 26 | 67.4 | 66.8251082625755 | 0.574891737424533 |
| 27 | 65.1 | 65.8409213526505 | -0.740921352650539 |
| 28 | 58.1 | 60.7941092896515 | -2.69410928965147 |
| 29 | 60.5 | 59.6333550300904 | 0.866644969909643 |
| 30 | 65.1 | 67.5854279760192 | -2.48542797601918 |
| 31 | 62.8 | 64.0116938673624 | -1.21169386736242 |
| 32 | 55.8 | 57.3005775001811 | -1.50057750018111 |
| 33 | 51.2 | 53.1771956835146 | -1.97719568351456 |
| 34 | 48.8 | 47.8547842616338 | 0.945215738366216 |
| 35 | 48.8 | 49.6761050499046 | -0.876105049904624 |
| 36 | 53.5 | 55.4700655062956 | -1.97006550629557 |
| 37 | 48.8 | 48.5836474736665 | 0.216352526333491 |
| 38 | 46.5 | 45.8103886334480 | 0.689611366552034 |
| 39 | 44.2 | 44.5505664818474 | -0.350566481847442 |
| 40 | 39.5 | 39.7033947426174 | -0.203394742617378 |
| 41 | 41.9 | 41.072764309111 | 0.827235690888995 |
| 42 | 48.8 | 49.0343439371241 | -0.234343937124065 |
| 43 | 46.5 | 47.6960265099107 | -1.19602650991073 |
| 44 | 41.9 | 41.2701106052565 | 0.629889394743483 |
| 45 | 39.5 | 39.0589768179366 | 0.441023182063362 |
| 46 | 37.2 | 36.6183779204601 | 0.581622079539923 |
| 47 | 37.2 | 39.0767049471421 | -1.87670494714208 |
| 48 | 41.9 | 44.3002644784788 | -2.40026447847883 |
| 49 | 39.5 | 36.8719655670482 | 2.62803443295175 |
| 50 | 39.5 | 39.4142884035659 | 0.0857115964341367 |
| 51 | 34.9 | 35.9502624000702 | -1.05026240007018 |
| 52 | 34.9 | 31.0922375871081 | 3.8077624128919 |
| 53 | 34.9 | 37.3317797027938 | -2.43177970279381 |
| 54 | 41.9 | 42.5825500063843 | -0.682550006384315 |
| 55 | 41.9 | 42.0903858234353 | -0.190385823435347 |
| 56 | 39.5 | 37.0442852126432 | 2.45571478735676 |
| 57 | 39.5 | 37.8005240884857 | 1.69947591151427 |
| 58 | 41.9 | 38.5555753017278 | 3.34442469827221 |
| 59 | 46.5 | 45.1520603571156 | 1.34793964288436 |
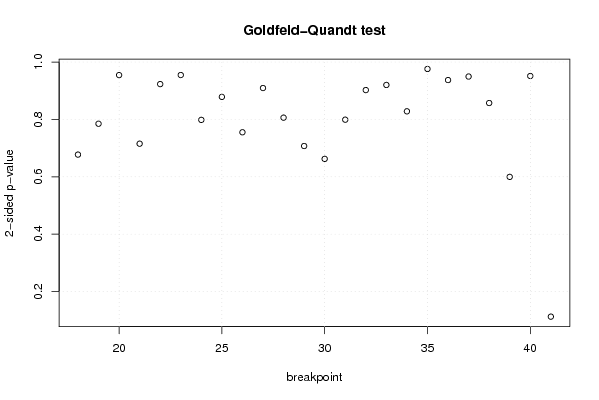
| Goldfeld-Quandt test for Heteroskedasticity | |||
| p-values | Alternative Hypothesis | ||
| breakpoint index | greater | 2-sided | less |
| 18 | 0.661345794156611 | 0.677308411686777 | 0.338654205843389 |
| 19 | 0.607522648886354 | 0.784954702227292 | 0.392477351113646 |
| 20 | 0.477272636688031 | 0.954545273376062 | 0.522727363311969 |
| 21 | 0.357684124951082 | 0.715368249902165 | 0.642315875048918 |
| 22 | 0.461584622014903 | 0.923169244029806 | 0.538415377985097 |
| 23 | 0.477383599257358 | 0.954767198514715 | 0.522616400742642 |
| 24 | 0.600799974313914 | 0.798400051372172 | 0.399200025686086 |
| 25 | 0.560763658117177 | 0.878472683765647 | 0.439236341882823 |
| 26 | 0.622426126324596 | 0.755147747350808 | 0.377573873675404 |
| 27 | 0.545277453458666 | 0.909445093082668 | 0.454722546541334 |
| 28 | 0.596932135865741 | 0.806135728268518 | 0.403067864134259 |
| 29 | 0.646357906218245 | 0.707284187563511 | 0.353642093781755 |
| 30 | 0.668782315122546 | 0.662435369754909 | 0.331217684877454 |
| 31 | 0.600480983078841 | 0.799038033842318 | 0.399519016921159 |
| 32 | 0.548824705030216 | 0.902350589939569 | 0.451175294969784 |
| 33 | 0.53988859933738 | 0.92022280132524 | 0.46011140066262 |
| 34 | 0.585872211256788 | 0.828255577486424 | 0.414127788743212 |
| 35 | 0.487983358822985 | 0.97596671764597 | 0.512016641177015 |
| 36 | 0.468632618205479 | 0.937265236410958 | 0.531367381794521 |
| 37 | 0.474729593360066 | 0.949459186720132 | 0.525270406639934 |
| 38 | 0.42859676450598 | 0.85719352901196 | 0.57140323549402 |
| 39 | 0.299814724165912 | 0.599629448331824 | 0.700185275834088 |
| 40 | 0.524308161756691 | 0.951383676486617 | 0.475691838243309 |
| 41 | 0.943853704802321 | 0.112292590395358 | 0.056146295197679 |
| Meta Analysis of Goldfeld-Quandt test for Heteroskedasticity | |||
| Description | # significant tests | % significant tests | OK/NOK |
| 1% type I error level | 0 | 0 | OK |
| 5% type I error level | 0 | 0 | OK |
| 10% type I error level | 0 | 0 | OK |