| Multiple Linear Regression - Estimated Regression Equation |
| Y[t] = + 1347837.27777778 + 168510.555555556X[t] + e[t] |
| Multiple Linear Regression - Ordinary Least Squares | |||||
| Variable | Parameter | S.D. | T-STAT H0: parameter = 0 | 2-tail p-value | 1-tail p-value |
| (Intercept) | 1347837.27777778 | 43662.663384 | 30.8693 | 0 | 0 |
| X | 168510.555555556 | 69036.732501 | 2.4409 | 0.017725 | 0.008863 |
| Multiple Linear Regression - Regression Statistics | |
| Multiple R | 0.305210702601077 |
| R-squared | 0.0931535729822429 |
| Adjusted R-squared | 0.0775182897577987 |
| F-TEST (value) | 5.95790761478546 |
| F-TEST (DF numerator) | 1 |
| F-TEST (DF denominator) | 58 |
| p-value | 0.0177254198313308 |
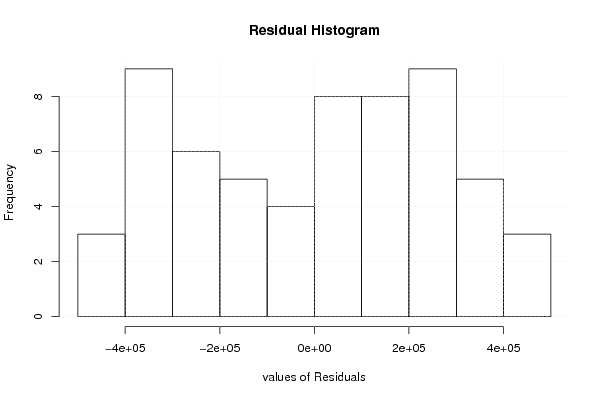
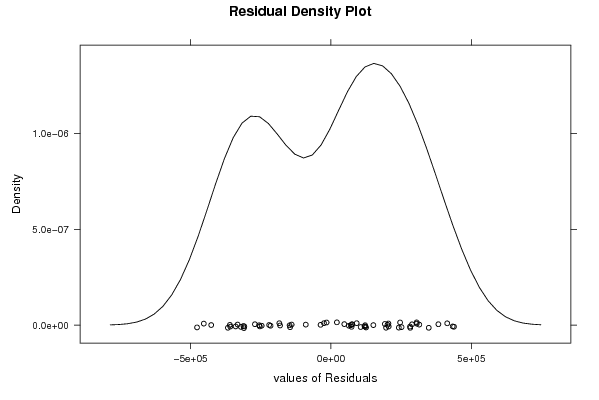
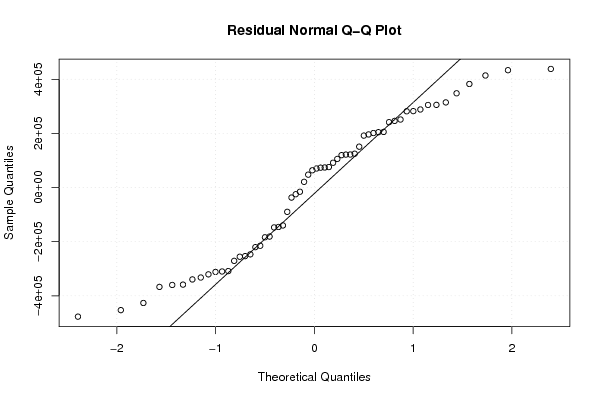
| Multiple Linear Regression - Residual Statistics | |
| Residual Standard Deviation | 261975.980301977 |
| Sum Squared Residuals | 3980622026800.56 |
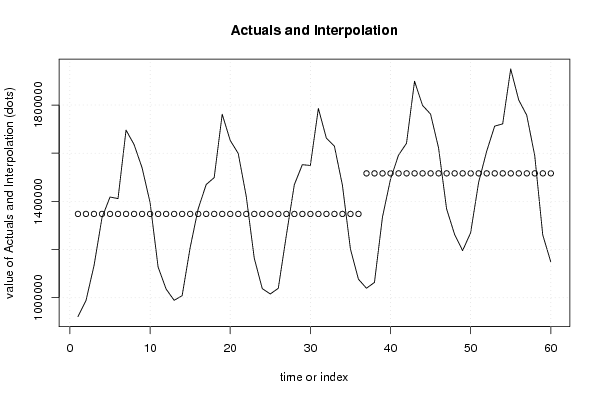
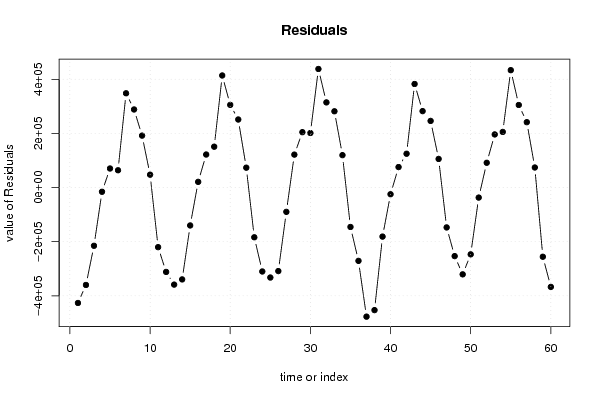
| Multiple Linear Regression - Actuals, Interpolation, and Residuals | |||
| Time or Index | Actuals | Interpolation Forecast | Residuals Prediction Error |
| 1 | 921365 | 1347837.27777778 | -426472.277777779 |
| 2 | 987921 | 1347837.27777778 | -359916.277777778 |
| 3 | 1132614 | 1347837.27777778 | -215223.277777778 |
| 4 | 1332224 | 1347837.27777778 | -15613.2777777777 |
| 5 | 1418133 | 1347837.27777778 | 70295.7222222223 |
| 6 | 1411549 | 1347837.27777778 | 63711.7222222223 |
| 7 | 1695920 | 1347837.27777778 | 348082.722222222 |
| 8 | 1636173 | 1347837.27777778 | 288335.722222222 |
| 9 | 1539653 | 1347837.27777778 | 191815.722222222 |
| 10 | 1395314 | 1347837.27777778 | 47476.7222222223 |
| 11 | 1127575 | 1347837.27777778 | -220262.277777778 |
| 12 | 1036076 | 1347837.27777778 | -311761.277777778 |
| 13 | 989236 | 1347837.27777778 | -358601.277777778 |
| 14 | 1008380 | 1347837.27777778 | -339457.277777778 |
| 15 | 1207763 | 1347837.27777778 | -140074.277777778 |
| 16 | 1368839 | 1347837.27777778 | 21001.7222222223 |
| 17 | 1469798 | 1347837.27777778 | 121960.722222222 |
| 18 | 1498721 | 1347837.27777778 | 150883.722222222 |
| 19 | 1761769 | 1347837.27777778 | 413931.722222222 |
| 20 | 1653214 | 1347837.27777778 | 305376.722222222 |
| 21 | 1599104 | 1347837.27777778 | 251266.722222222 |
| 22 | 1421179 | 1347837.27777778 | 73341.7222222223 |
| 23 | 1163995 | 1347837.27777778 | -183842.277777778 |
| 24 | 1037735 | 1347837.27777778 | -310102.277777778 |
| 25 | 1015407 | 1347837.27777778 | -332430.277777778 |
| 26 | 1039210 | 1347837.27777778 | -308627.277777778 |
| 27 | 1258049 | 1347837.27777778 | -89788.2777777777 |
| 28 | 1469445 | 1347837.27777778 | 121607.722222222 |
| 29 | 1552346 | 1347837.27777778 | 204508.722222222 |
| 30 | 1549144 | 1347837.27777778 | 201306.722222222 |
| 31 | 1785895 | 1347837.27777778 | 438057.722222222 |
| 32 | 1662335 | 1347837.27777778 | 314497.722222222 |
| 33 | 1629440 | 1347837.27777778 | 281602.722222222 |
| 34 | 1467430 | 1347837.27777778 | 119592.722222222 |
| 35 | 1202209 | 1347837.27777778 | -145628.277777778 |
| 36 | 1076982 | 1347837.27777778 | -270855.277777778 |
| 37 | 1039367 | 1516347.83333333 | -476980.833333333 |
| 38 | 1063449 | 1516347.83333333 | -452898.833333333 |
| 39 | 1335135 | 1516347.83333333 | -181212.833333333 |
| 40 | 1491602 | 1516347.83333333 | -24745.8333333333 |
| 41 | 1591972 | 1516347.83333333 | 75624.1666666667 |
| 42 | 1641248 | 1516347.83333333 | 124900.166666667 |
| 43 | 1898849 | 1516347.83333333 | 382501.166666667 |
| 44 | 1798580 | 1516347.83333333 | 282232.166666667 |
| 45 | 1762444 | 1516347.83333333 | 246096.166666667 |
| 46 | 1622044 | 1516347.83333333 | 105696.166666667 |
| 47 | 1368955 | 1516347.83333333 | -147392.833333333 |
| 48 | 1262973 | 1516347.83333333 | -253374.833333333 |
| 49 | 1195650 | 1516347.83333333 | -320697.833333333 |
| 50 | 1269530 | 1516347.83333333 | -246817.833333333 |
| 51 | 1479279 | 1516347.83333333 | -37068.8333333333 |
| 52 | 1607819 | 1516347.83333333 | 91471.1666666667 |
| 53 | 1712466 | 1516347.83333333 | 196118.166666667 |
| 54 | 1721766 | 1516347.83333333 | 205418.166666667 |
| 55 | 1949843 | 1516347.83333333 | 433495.166666667 |
| 56 | 1821326 | 1516347.83333333 | 304978.166666667 |
| 57 | 1757802 | 1516347.83333333 | 241454.166666667 |
| 58 | 1590367 | 1516347.83333333 | 74019.1666666667 |
| 59 | 1260647 | 1516347.83333333 | -255700.833333333 |
| 60 | 1149235 | 1516347.83333333 | -367112.833333333 |
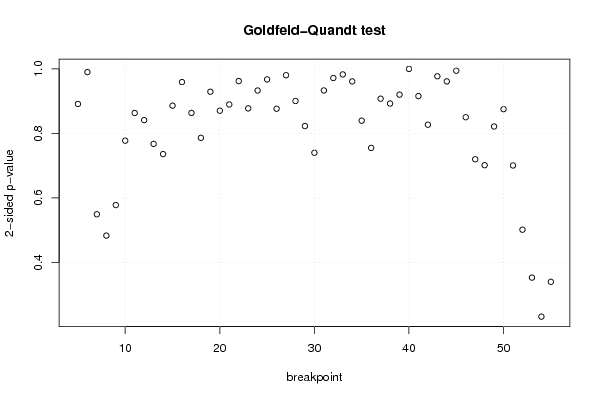
| Goldfeld-Quandt test for Heteroskedasticity | |||
| p-values | Alternative Hypothesis | ||
| breakpoint index | greater | 2-sided | less |
| 5 | 0.554457886942039 | 0.891084226115923 | 0.445542113057961 |
| 6 | 0.50505414127507 | 0.98989171744986 | 0.49494585872493 |
| 7 | 0.725395368905702 | 0.549209262188596 | 0.274604631094298 |
| 8 | 0.758443702524847 | 0.483112594950307 | 0.241556297475153 |
| 9 | 0.711127758052574 | 0.577744483894853 | 0.288872241947426 |
| 10 | 0.611339959345204 | 0.777320081309592 | 0.388660040654796 |
| 11 | 0.568414631578358 | 0.863170736843284 | 0.431585368421642 |
| 12 | 0.579494961572586 | 0.841010076854828 | 0.420505038427414 |
| 13 | 0.616299525200195 | 0.76740094959961 | 0.383700474799805 |
| 14 | 0.632088498272051 | 0.735823003455898 | 0.367911501727949 |
| 15 | 0.557055458656248 | 0.885889082687504 | 0.442944541343752 |
| 16 | 0.479515164323883 | 0.959030328647767 | 0.520484835676117 |
| 17 | 0.431652096149643 | 0.863304192299286 | 0.568347903850357 |
| 18 | 0.393060625334499 | 0.786121250668997 | 0.606939374665501 |
| 19 | 0.535483813802373 | 0.929032372395255 | 0.464516186197627 |
| 20 | 0.56489322504535 | 0.8702135499093 | 0.43510677495465 |
| 21 | 0.5552466496208 | 0.8895067007584 | 0.4447533503792 |
| 22 | 0.480988053099068 | 0.961976106198135 | 0.519011946900932 |
| 23 | 0.438699139508305 | 0.87739827901661 | 0.561300860491695 |
| 24 | 0.466403062301546 | 0.932806124603091 | 0.533596937698454 |
| 25 | 0.516370080941338 | 0.967259838117324 | 0.483629919058662 |
| 26 | 0.561845130308733 | 0.876309739382535 | 0.438154869691267 |
| 27 | 0.509874903706299 | 0.980250192587401 | 0.490125096293701 |
| 28 | 0.450198808380308 | 0.900397616760616 | 0.549801191619692 |
| 29 | 0.411308462002591 | 0.822616924005181 | 0.588691537997409 |
| 30 | 0.369900152295033 | 0.739800304590066 | 0.630099847704967 |
| 31 | 0.466499551836599 | 0.932999103673197 | 0.533500448163401 |
| 32 | 0.485799511246833 | 0.971599022493666 | 0.514200488753167 |
| 33 | 0.508647337042729 | 0.982705325914542 | 0.491352662957271 |
| 34 | 0.480477255189741 | 0.960954510379482 | 0.519522744810259 |
| 35 | 0.419638247112229 | 0.839276494224457 | 0.580361752887771 |
| 36 | 0.377423004643332 | 0.754846009286663 | 0.622576995356668 |
| 37 | 0.453745387760086 | 0.907490775520172 | 0.546254612239914 |
| 38 | 0.553772229162595 | 0.89245554167481 | 0.446227770837405 |
| 39 | 0.540029999861488 | 0.919940000277024 | 0.459970000138512 |
| 40 | 0.500180750269688 | 0.999638499460625 | 0.499819249730312 |
| 41 | 0.457765486423171 | 0.915530972846342 | 0.542234513576829 |
| 42 | 0.413420675179528 | 0.826841350359055 | 0.586579324820472 |
| 43 | 0.511508877532116 | 0.976982244935768 | 0.488491122467884 |
| 44 | 0.519425511061089 | 0.961148977877822 | 0.480574488938911 |
| 45 | 0.502922377059357 | 0.994155245881286 | 0.497077622940643 |
| 46 | 0.424994343937825 | 0.84998868787565 | 0.575005656062175 |
| 47 | 0.359859599437750 | 0.719719198875499 | 0.64014040056225 |
| 48 | 0.350689688439085 | 0.70137937687817 | 0.649310311560915 |
| 49 | 0.410652126374472 | 0.821304252748943 | 0.589347873625528 |
| 50 | 0.437467364764757 | 0.874934729529515 | 0.562532635235243 |
| 51 | 0.350243532428436 | 0.700487064856871 | 0.649756467571564 |
| 52 | 0.250710094258610 | 0.501420188517221 | 0.749289905741390 |
| 53 | 0.176441639480952 | 0.352883278961904 | 0.823558360519048 |
| 54 | 0.115955214840112 | 0.231910429680224 | 0.884044785159888 |
| 55 | 0.169937949983239 | 0.339875899966478 | 0.83006205001676 |
| Meta Analysis of Goldfeld-Quandt test for Heteroskedasticity | |||
| Description | # significant tests | % significant tests | OK/NOK |
| 1% type I error level | 0 | 0 | OK |
| 5% type I error level | 0 | 0 | OK |
| 10% type I error level | 0 | 0 | OK |