| Multiple Linear Regression - Estimated Regression Equation |
| Y[t] = + 1045195.97777778 + 168510.555555556X[t] -80395.2M1[t] -38902.1999999998M2[t] + 169967.8M3[t] + 341385.6M4[t] + 436342.8M5[t] + 451885.4M6[t] + 705855M7[t] + 601725.4M8[t] + 545088.4M9[t] + 386666.6M10[t] + 112076M11[t] + e[t] |
| Multiple Linear Regression - Ordinary Least Squares | |||||
| Variable | Parameter | S.D. | T-STAT H0: parameter = 0 | 2-tail p-value | 1-tail p-value |
| (Intercept) | 1045195.97777778 | 24951.865374 | 41.8885 | 0 | 0 |
| X | 168510.555555556 | 14310.876265 | 11.775 | 0 | 0 |
| M1 | -80395.2 | 34346.103037 | -2.3407 | 0.02354 | 0.01177 |
| M2 | -38902.1999999998 | 34346.103037 | -1.1327 | 0.263106 | 0.131553 |
| M3 | 169967.8 | 34346.103037 | 4.9487 | 1e-05 | 5e-06 |
| M4 | 341385.6 | 34346.103037 | 9.9396 | 0 | 0 |
| M5 | 436342.8 | 34346.103037 | 12.7043 | 0 | 0 |
| M6 | 451885.4 | 34346.103037 | 13.1568 | 0 | 0 |
| M7 | 705855 | 34346.103037 | 20.5512 | 0 | 0 |
| M8 | 601725.4 | 34346.103037 | 17.5195 | 0 | 0 |
| M9 | 545088.4 | 34346.103037 | 15.8705 | 0 | 0 |
| M10 | 386666.6 | 34346.103037 | 11.2579 | 0 | 0 |
| M11 | 112076 | 34346.103037 | 3.2631 | 0.002057 | 0.001028 |
| Multiple Linear Regression - Regression Statistics | |
| Multiple R | 0.984084678928848 |
| R-squared | 0.968422655302495 |
| Adjusted R-squared | 0.960360354528664 |
| F-TEST (value) | 120.117405994804 |
| F-TEST (DF numerator) | 12 |
| F-TEST (DF denominator) | 47 |
| p-value | 0 |
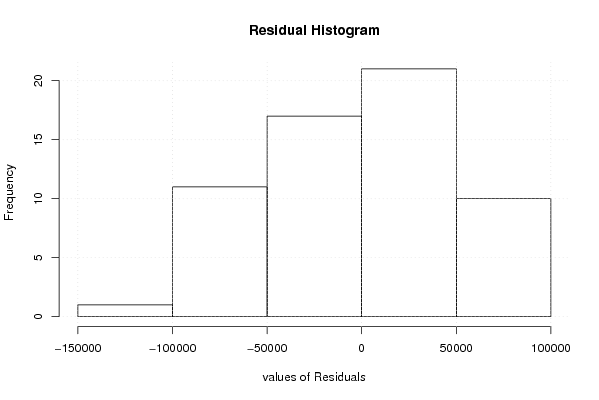
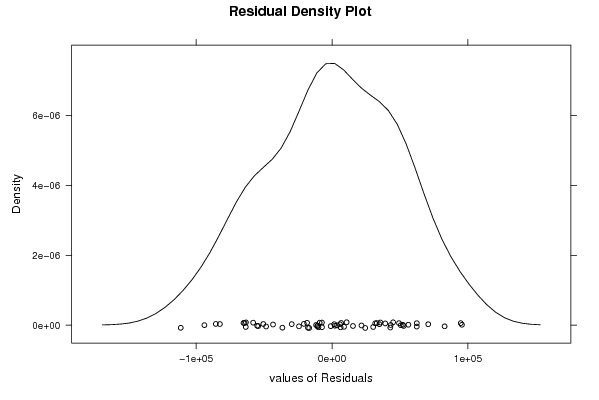
| Multiple Linear Regression - Residual Statistics | |
| Residual Standard Deviation | 54305.9571739398 |
| Sum Squared Residuals | 138609438275.156 |
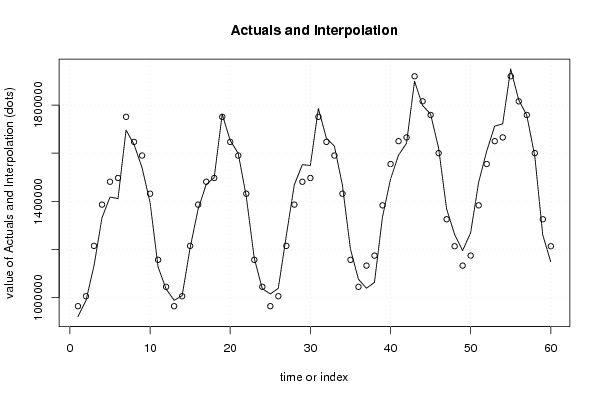
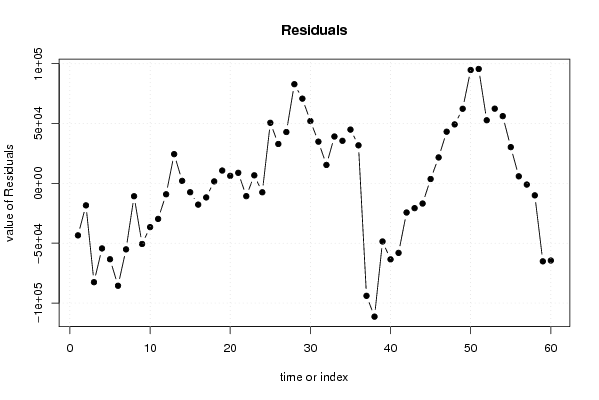
| Multiple Linear Regression - Actuals, Interpolation, and Residuals | |||
| Time or Index | Actuals | Interpolation Forecast | Residuals Prediction Error |
| 1 | 921365 | 964800.777777778 | -43435.7777777785 |
| 2 | 987921 | 1006293.77777778 | -18372.7777777777 |
| 3 | 1132614 | 1215163.77777778 | -82549.777777778 |
| 4 | 1332224 | 1386581.57777778 | -54357.5777777783 |
| 5 | 1418133 | 1481538.77777778 | -63405.7777777776 |
| 6 | 1411549 | 1497081.37777778 | -85532.3777777784 |
| 7 | 1695920 | 1751050.97777778 | -55130.9777777775 |
| 8 | 1636173 | 1646921.37777778 | -10748.3777777777 |
| 9 | 1539653 | 1590284.37777778 | -50631.3777777775 |
| 10 | 1395314 | 1431862.57777778 | -36548.577777778 |
| 11 | 1127575 | 1157271.97777778 | -29696.9777777779 |
| 12 | 1036076 | 1045195.97777778 | -9119.97777777775 |
| 13 | 989236 | 964800.777777778 | 24435.2222222225 |
| 14 | 1008380 | 1006293.77777778 | 2086.22222222229 |
| 15 | 1207763 | 1215163.77777778 | -7400.77777777767 |
| 16 | 1368839 | 1386581.57777778 | -17742.5777777776 |
| 17 | 1469798 | 1481538.77777778 | -11740.7777777778 |
| 18 | 1498721 | 1497081.37777778 | 1639.62222222243 |
| 19 | 1761769 | 1751050.97777778 | 10718.0222222222 |
| 20 | 1653214 | 1646921.37777778 | 6292.62222222227 |
| 21 | 1599104 | 1590284.37777778 | 8819.62222222225 |
| 22 | 1421179 | 1431862.57777778 | -10683.5777777777 |
| 23 | 1163995 | 1157271.97777778 | 6723.02222222224 |
| 24 | 1037735 | 1045195.97777778 | -7460.97777777782 |
| 25 | 1015407 | 964800.777777778 | 50606.2222222224 |
| 26 | 1039210 | 1006293.77777778 | 32916.2222222222 |
| 27 | 1258049 | 1215163.77777778 | 42885.2222222223 |
| 28 | 1469445 | 1386581.57777778 | 82863.4222222224 |
| 29 | 1552346 | 1481538.77777778 | 70807.2222222222 |
| 30 | 1549144 | 1497081.37777778 | 52062.6222222224 |
| 31 | 1785895 | 1751050.97777778 | 34844.0222222222 |
| 32 | 1662335 | 1646921.37777778 | 15413.6222222223 |
| 33 | 1629440 | 1590284.37777778 | 39155.6222222222 |
| 34 | 1467430 | 1431862.57777778 | 35567.4222222223 |
| 35 | 1202209 | 1157271.97777778 | 44937.0222222222 |
| 36 | 1076982 | 1045195.97777778 | 31786.0222222222 |
| 37 | 1039367 | 1133311.33333333 | -93944.3333333332 |
| 38 | 1063449 | 1174804.33333333 | -111355.333333333 |
| 39 | 1335135 | 1383674.33333333 | -48539.3333333333 |
| 40 | 1491602 | 1555092.13333333 | -63490.1333333332 |
| 41 | 1591972 | 1650049.33333333 | -58077.3333333334 |
| 42 | 1641248 | 1665591.93333333 | -24343.9333333332 |
| 43 | 1898849 | 1919561.53333333 | -20712.5333333335 |
| 44 | 1798580 | 1815431.93333333 | -16851.9333333334 |
| 45 | 1762444 | 1758794.93333333 | 3649.0666666665 |
| 46 | 1622044 | 1600373.13333333 | 21670.8666666667 |
| 47 | 1368955 | 1325782.53333333 | 43172.4666666667 |
| 48 | 1262973 | 1213706.53333333 | 49266.4666666667 |
| 49 | 1195650 | 1133311.33333333 | 62338.6666666668 |
| 50 | 1269530 | 1174804.33333333 | 94725.6666666666 |
| 51 | 1479279 | 1383674.33333333 | 95604.6666666667 |
| 52 | 1607819 | 1555092.13333333 | 52726.8666666668 |
| 53 | 1712466 | 1650049.33333333 | 62416.6666666666 |
| 54 | 1721766 | 1665591.93333333 | 56174.0666666668 |
| 55 | 1949843 | 1919561.53333333 | 30281.4666666665 |
| 56 | 1821326 | 1815431.93333333 | 5894.06666666659 |
| 57 | 1757802 | 1758794.93333333 | -992.933333333494 |
| 58 | 1590367 | 1600373.13333333 | -10006.1333333333 |
| 59 | 1260647 | 1325782.53333333 | -65135.5333333333 |
| 60 | 1149235 | 1213706.53333333 | -64471.5333333333 |
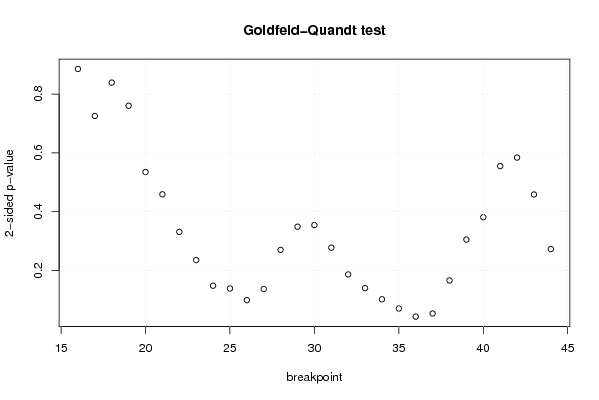
| Goldfeld-Quandt test for Heteroskedasticity | |||
| p-values | Alternative Hypothesis | ||
| breakpoint index | greater | 2-sided | less |
| 16 | 0.442654178661467 | 0.885308357322935 | 0.557345821338533 |
| 17 | 0.362741308115422 | 0.725482616230845 | 0.637258691884578 |
| 18 | 0.419445618261116 | 0.838891236522231 | 0.580554381738885 |
| 19 | 0.380070717909146 | 0.760141435818292 | 0.619929282090854 |
| 20 | 0.267265838113182 | 0.534531676226364 | 0.732734161886818 |
| 21 | 0.229397923493232 | 0.458795846986465 | 0.770602076506768 |
| 22 | 0.165447712926016 | 0.330895425852033 | 0.834552287073984 |
| 23 | 0.117516995030308 | 0.235033990060615 | 0.882483004969692 |
| 24 | 0.073977930227833 | 0.147955860455666 | 0.926022069772167 |
| 25 | 0.069142234677704 | 0.138284469355408 | 0.930857765322296 |
| 26 | 0.0493406925899472 | 0.0986813851798944 | 0.950659307410053 |
| 27 | 0.068363532072556 | 0.136727064145112 | 0.931636467927444 |
| 28 | 0.134869031157357 | 0.269738062314713 | 0.865130968842643 |
| 29 | 0.174300952456566 | 0.348601904913133 | 0.825699047543434 |
| 30 | 0.177036149341459 | 0.354072298682918 | 0.82296385065854 |
| 31 | 0.138599896020545 | 0.277199792041089 | 0.861400103979455 |
| 32 | 0.09308949026109 | 0.18617898052218 | 0.90691050973891 |
| 33 | 0.069789918693852 | 0.139579837387704 | 0.930210081306148 |
| 34 | 0.0508363554079484 | 0.101672710815897 | 0.949163644592051 |
| 35 | 0.0351124327319314 | 0.0702248654638628 | 0.964887567268069 |
| 36 | 0.0212861219538104 | 0.0425722439076207 | 0.97871387804619 |
| 37 | 0.0267056996137177 | 0.0534113992274354 | 0.973294300386282 |
| 38 | 0.0828665010136855 | 0.165733002027371 | 0.917133498986314 |
| 39 | 0.152437404749983 | 0.304874809499965 | 0.847562595250017 |
| 40 | 0.190387218107534 | 0.380774436215069 | 0.809612781892466 |
| 41 | 0.277341796207270 | 0.554683592414541 | 0.72265820379273 |
| 42 | 0.291877197130982 | 0.583754394261965 | 0.708122802869018 |
| 43 | 0.229101915105716 | 0.458203830211432 | 0.770898084894284 |
| 44 | 0.136208317819548 | 0.272416635639096 | 0.863791682180452 |
| Meta Analysis of Goldfeld-Quandt test for Heteroskedasticity | |||
| Description | # significant tests | % significant tests | OK/NOK |
| 1% type I error level | 0 | 0 | OK |
| 5% type I error level | 1 | 0.0344827586206897 | OK |
| 10% type I error level | 4 | 0.137931034482759 | NOK |