| Multiple Linear Regression - Estimated Regression Equation |
| werkl[t] = -0.395712991636488 + 0.269567934887980afzetp[t] -3.79013568721123M1[t] -3.21395655816536M2[t] -6.56078146518992M3[t] -4.87045347166873M4[t] -3.97578920142145M5[t] -2.65155387116502M6[t] -7.54172565371467M7[t] -2.45587483350240M8[t] -2.04195046420927M9[t] -2.31005489925694M10[t] -0.302773237368129M11[t] -0.210015990850824t + e[t] |
| Multiple Linear Regression - Ordinary Least Squares | |||||
| Variable | Parameter | S.D. | T-STAT H0: parameter = 0 | 2-tail p-value | 1-tail p-value |
| (Intercept) | -0.395712991636488 | 4.145033 | -0.0955 | 0.924268 | 0.462134 |
| afzetp | 0.269567934887980 | 0.031078 | 8.6738 | 0 | 0 |
| M1 | -3.79013568721123 | 4.676195 | -0.8105 | 0.4209 | 0.21045 |
| M2 | -3.21395655816536 | 4.884167 | -0.658 | 0.513075 | 0.256537 |
| M3 | -6.56078146518992 | 4.919882 | -1.3335 | 0.187486 | 0.093743 |
| M4 | -4.87045347166873 | 4.881645 | -0.9977 | 0.322496 | 0.161248 |
| M5 | -3.97578920142145 | 4.866318 | -0.817 | 0.417214 | 0.208607 |
| M6 | -2.65155387116502 | 4.852244 | -0.5465 | 0.586811 | 0.293405 |
| M7 | -7.54172565371467 | 4.889913 | -1.5423 | 0.128347 | 0.064174 |
| M8 | -2.45587483350240 | 4.849025 | -0.5065 | 0.614416 | 0.307208 |
| M9 | -2.04195046420927 | 4.849357 | -0.4211 | 0.675229 | 0.337615 |
| M10 | -2.31005489925694 | 4.850378 | -0.4763 | 0.635646 | 0.317823 |
| M11 | -0.302773237368129 | 4.841556 | -0.0625 | 0.950347 | 0.475174 |
| t | -0.210015990850824 | 0.04853 | -4.3275 | 5.9e-05 | 3e-05 |
| Multiple Linear Regression - Regression Statistics | |
| Multiple R | 0.76096849416809 |
| R-squared | 0.57907304911645 |
| Adjusted R-squared | 0.486326432820075 |
| F-TEST (value) | 6.24360297162756 |
| F-TEST (DF numerator) | 13 |
| F-TEST (DF denominator) | 59 |
| p-value | 3.46713284971045e-07 |
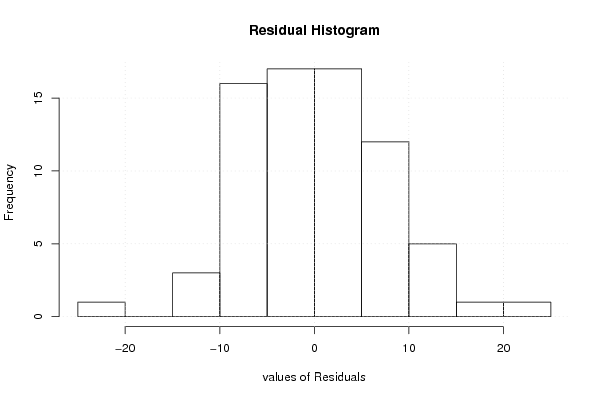
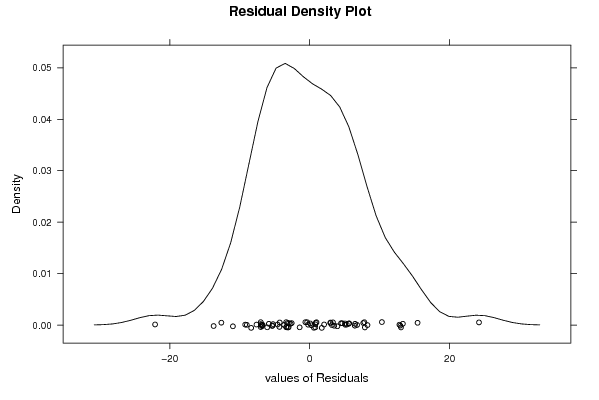
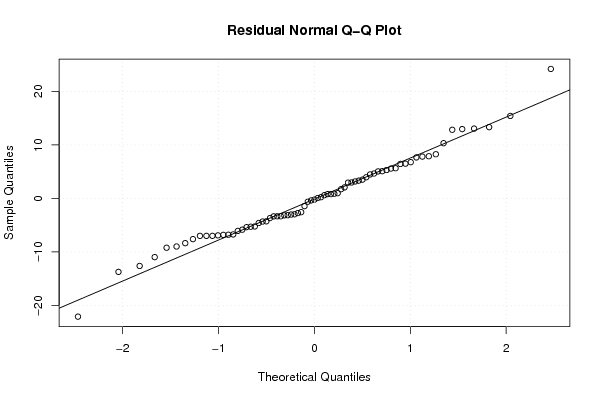
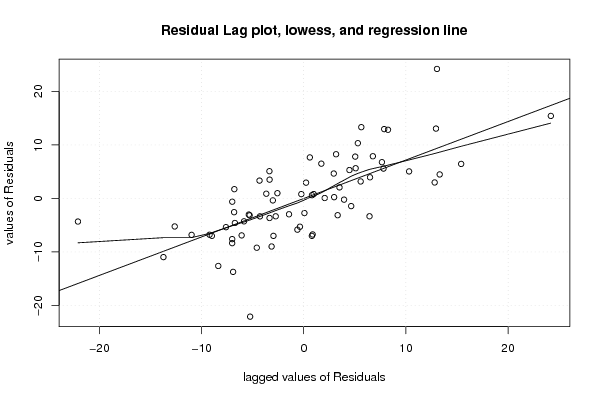
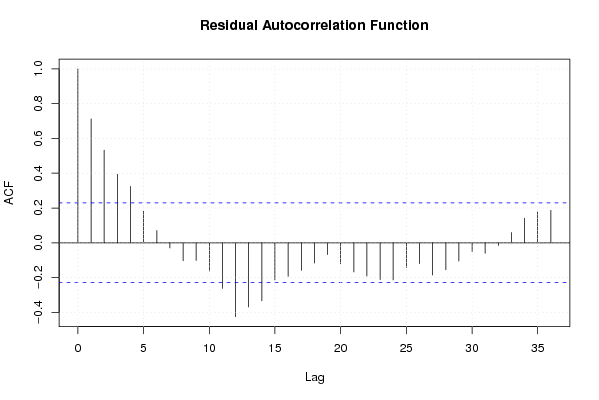
| Multiple Linear Regression - Residual Statistics | |
| Residual Standard Deviation | 8.38491643678452 |
| Sum Squared Residuals | 4148.10259545969 |
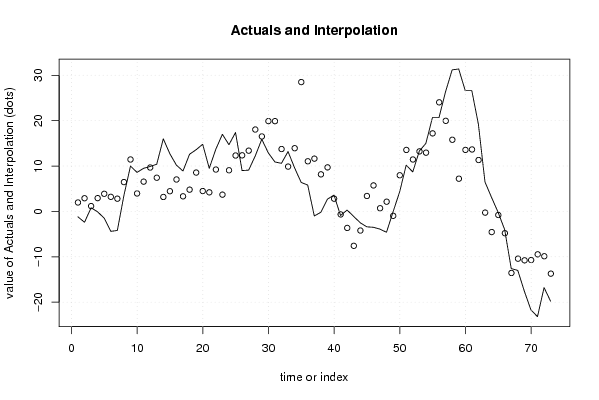
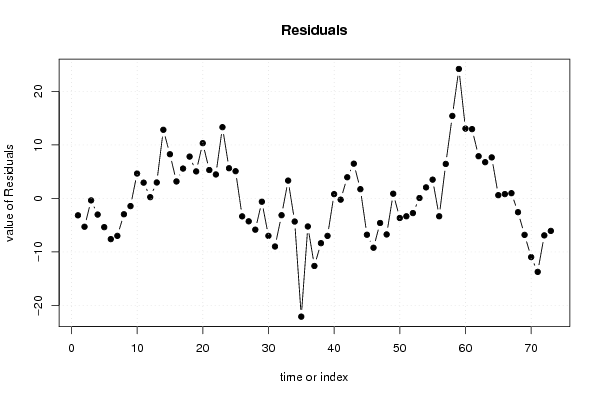
| Multiple Linear Regression - Actuals, Interpolation, and Residuals | |||
| Time or Index | Actuals | Interpolation Forecast | Residuals Prediction Error |
| 1 | -1.2 | 1.96593859365773 | -3.16593859365773 |
| 2 | -2.4 | 2.89819439511755 | -5.29819439511755 |
| 3 | 0.8 | 1.17441545448043 | -0.374415454480434 |
| 4 | -0.1 | 2.92429539203879 | -3.02429539203879 |
| 5 | -1.5 | 3.87851160632323 | -5.37851160632323 |
| 6 | -4.4 | 3.21358257546817 | -7.61358257546817 |
| 7 | -4.2 | 2.80387686911853 | -7.00387686911853 |
| 8 | 3.5 | 6.46665599148408 | -2.96665599148408 |
| 9 | 10 | 11.4419168174436 | -1.44191681744361 |
| 10 | 8.6 | 3.95503008445764 | 4.64496991554236 |
| 11 | 9.5 | 6.56099956015958 | 2.93900043984042 |
| 12 | 9.9 | 9.67291767742227 | 0.227082322577732 |
| 13 | 10.4 | 7.42495757613207 | 2.97504242386793 |
| 14 | 16 | 3.18150902774265 | 12.8184909722573 |
| 15 | 12.7 | 4.44993416436212 | 8.25006583563788 |
| 16 | 10.2 | 7.0354747000732 | 3.1645252999268 |
| 17 | 8.9 | 3.32616564079559 | 5.57383435920441 |
| 18 | 12.6 | 4.79082329555557 | 7.80917670444443 |
| 19 | 13.6 | 8.55942057996962 | 5.04057942003038 |
| 20 | 14.8 | 4.48559997105015 | 10.3144000289499 |
| 21 | 9.5 | 4.20428606669409 | 5.29571393330591 |
| 22 | 13.7 | 9.22535151251037 | 4.47464848748963 |
| 23 | 17 | 3.69036935459531 | 13.3096306454047 |
| 24 | 14.7 | 9.06665812491702 | 5.63334187508298 |
| 25 | 17.4 | 12.3178838953416 | 5.08211610465838 |
| 26 | 9 | 12.3605655116711 | -3.36056551167109 |
| 27 | 9.1 | 13.3863795068914 | -4.28637950689136 |
| 28 | 12.2 | 18.0475931412399 | -5.84759314123989 |
| 29 | 15.9 | 16.5217843545549 | -0.621784354554908 |
| 30 | 12.9 | 19.9003743470195 | -7.00037434701954 |
| 31 | 10.9 | 19.8950205430019 | -8.99502054300188 |
| 32 | 10.6 | 13.7455268354450 | -3.14552683544497 |
| 33 | 13.2 | 9.87895939707878 | 3.32104060292122 |
| 34 | 9.6 | 13.9295802772983 | -4.32958027729833 |
| 35 | 6.4 | 28.5043660620266 | -22.1043660620266 |
| 36 | 5.8 | 11.0482507473364 | -5.24825074733639 |
| 37 | -1 | 11.63075396237 | -12.63075396237 |
| 38 | -0.2 | 8.16905242515572 | -8.36905242515572 |
| 39 | 2.7 | 9.70704549666316 | -7.00704549666316 |
| 40 | 3.6 | 2.80379472431736 | 0.796205275682643 |
| 41 | -0.9 | -0.662903193561076 | -0.237096806438924 |
| 42 | 0.3 | -3.64611646445276 | 3.94611646445276 |
| 43 | -1.1 | -7.58716211783493 | 6.48716211783492 |
| 44 | -2.5 | -4.22090772384616 | 1.72090772384616 |
| 45 | -3.4 | 3.39611886401558 | -6.79611886401558 |
| 46 | -3.5 | 5.72150496095207 | -9.22150496095207 |
| 47 | -3.9 | 0.698701879324174 | -4.59870187932417 |
| 48 | -4.6 | 2.13929880028138 | -6.73929880028138 |
| 49 | -0.1 | -0.97127869265034 | 0.871278692650341 |
| 50 | 4.3 | 7.96714477498246 | -3.66714477498246 |
| 51 | 10.2 | 13.5486568698096 | -3.34865686980959 |
| 52 | 8.7 | 11.4437153384698 | -2.74371533846983 |
| 53 | 13.3 | 13.2335921509070 | 0.0664078490930123 |
| 54 | 15 | 12.9460582288951 | 2.05394177110489 |
| 55 | 20.7 | 17.1998777961075 | 3.50012220389248 |
| 56 | 20.7 | 24.0435585501512 | -3.34355855015123 |
| 57 | 26.4 | 19.9613367638746 | 6.43866323612535 |
| 58 | 31.2 | 15.7901356300108 | 15.4098643699892 |
| 59 | 31.4 | 7.2090358078616 | 24.1909641921384 |
| 60 | 26.6 | 13.5557691437800 | 13.0442308562200 |
| 61 | 26.6 | 13.6530500760153 | 12.9469499239847 |
| 62 | 19.2 | 11.3235338653305 | 7.87646613466948 |
| 63 | 6.5 | -0.266431492206655 | 6.76643149220665 |
| 64 | 3.1 | -4.55487329613905 | 7.65487329613905 |
| 65 | -0.2 | -0.797150559019634 | 0.597150559019634 |
| 66 | -4 | -4.80472198248564 | 0.80472198248564 |
| 67 | -12.6 | -13.5710336703626 | 0.971033670362639 |
| 68 | -13 | -10.4204336242843 | -2.57956637571574 |
| 69 | -17.6 | -10.7826179091067 | -6.81738209089328 |
| 70 | -21.7 | -10.7216024652293 | -10.9783975347707 |
| 71 | -23.2 | -9.46347266396723 | -13.7365273360328 |
| 72 | -16.8 | -9.88289449373708 | -6.91710550626292 |
| 73 | -19.8 | -13.7213054108663 | -6.07869458913365 |
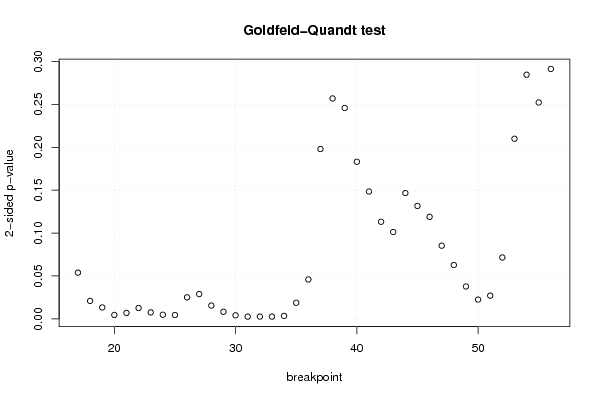
| Goldfeld-Quandt test for Heteroskedasticity | |||
| p-values | Alternative Hypothesis | ||
| breakpoint index | greater | 2-sided | less |
| 17 | 0.0269554892614231 | 0.0539109785228463 | 0.973044510738577 |
| 18 | 0.0104800889535189 | 0.0209601779070379 | 0.98951991104648 |
| 19 | 0.00665306702811855 | 0.0133061340562371 | 0.993346932971881 |
| 20 | 0.00229457648338451 | 0.00458915296676901 | 0.997705423516616 |
| 21 | 0.00346627964060500 | 0.00693255928120999 | 0.996533720359395 |
| 22 | 0.00632975750363037 | 0.0126595150072607 | 0.99367024249637 |
| 23 | 0.0037816846383959 | 0.0075633692767918 | 0.996218315361604 |
| 24 | 0.00240600934000037 | 0.00481201868000074 | 0.99759399066 |
| 25 | 0.00225257153335625 | 0.00450514306671250 | 0.997747428466644 |
| 26 | 0.0125587207318685 | 0.025117441463737 | 0.987441279268132 |
| 27 | 0.0144658177121489 | 0.0289316354242978 | 0.985534182287851 |
| 28 | 0.00776479685666114 | 0.0155295937133223 | 0.992235203143339 |
| 29 | 0.00414390456757448 | 0.00828780913514897 | 0.995856095432426 |
| 30 | 0.00207434706179193 | 0.00414869412358386 | 0.997925652938208 |
| 31 | 0.00129857855631771 | 0.00259715711263542 | 0.998701421443682 |
| 32 | 0.00133881227783150 | 0.00267762455566299 | 0.998661187722168 |
| 33 | 0.00133409674903054 | 0.00266819349806108 | 0.99866590325097 |
| 34 | 0.00173713520495706 | 0.00347427040991412 | 0.998262864795043 |
| 35 | 0.00938724341986912 | 0.0187744868397382 | 0.99061275658013 |
| 36 | 0.0229985690588749 | 0.0459971381177499 | 0.977001430941125 |
| 37 | 0.0990025231509527 | 0.198005046301905 | 0.900997476849047 |
| 38 | 0.128507798099518 | 0.257015596199035 | 0.871492201900482 |
| 39 | 0.122944689325034 | 0.245889378650069 | 0.877055310674966 |
| 40 | 0.0915940317226047 | 0.183188063445209 | 0.908405968277395 |
| 41 | 0.074262789671464 | 0.148525579342928 | 0.925737210328536 |
| 42 | 0.0566144801933333 | 0.113228960386667 | 0.943385519806667 |
| 43 | 0.0506457343918204 | 0.101291468783641 | 0.94935426560818 |
| 44 | 0.0733580370577546 | 0.146716074115509 | 0.926641962942245 |
| 45 | 0.0658328457246812 | 0.131665691449362 | 0.934167154275319 |
| 46 | 0.0594801834462871 | 0.118960366892574 | 0.940519816553713 |
| 47 | 0.0426631868431816 | 0.0853263736863631 | 0.957336813156818 |
| 48 | 0.0313845767372419 | 0.0627691534744837 | 0.968615423262758 |
| 49 | 0.0188846700397340 | 0.0377693400794679 | 0.981115329960266 |
| 50 | 0.0112333889602400 | 0.0224667779204800 | 0.98876661103976 |
| 51 | 0.0135368868317787 | 0.0270737736635574 | 0.986463113168221 |
| 52 | 0.0357932608962189 | 0.0715865217924378 | 0.964206739103781 |
| 53 | 0.105008938770074 | 0.210017877540148 | 0.894991061229926 |
| 54 | 0.85766776689343 | 0.284664466213141 | 0.142332233106570 |
| 55 | 0.87384826060029 | 0.252303478799418 | 0.126151739399709 |
| 56 | 0.854302040008583 | 0.291395919982834 | 0.145697959991417 |
| Meta Analysis of Goldfeld-Quandt test for Heteroskedasticity | |||
| Description | # significant tests | % significant tests | OK/NOK |
| 1% type I error level | 11 | 0.275 | NOK |
| 5% type I error level | 22 | 0.55 | NOK |
| 10% type I error level | 26 | 0.65 | NOK |