| Multiple Linear Regression - Estimated Regression Equation |
| ChemischeIndustrie[t] = + 176.025891938060 -0.0971364760405873Werkloosheid[t] -13.0379049225199Dummy[t] -4.05345478350426Dummy2[t] + 1.34206810010027M1[t] -2.50509520992201M2[t] -2.00322924642182M3[t] + 1.29920942187024M4[t] -4.16002535649746M5[t] + 2.07391207534814M6[t] -4.84303188385203M7[t] -5.86222199450384M8[t] -0.999783326211778M9[t] + 1.92234266806906M10[t] + 3.83886385409737M11[t] -0.0887384210027683t + e[t] |
| Multiple Linear Regression - Ordinary Least Squares | |||||
| Variable | Parameter | S.D. | T-STAT H0: parameter = 0 | 2-tail p-value | 1-tail p-value |
| (Intercept) | 176.025891938060 | 24.398066 | 7.2147 | 0 | 0 |
| Werkloosheid | -0.0971364760405873 | 0.037984 | -2.5573 | 0.014073 | 0.007037 |
| Dummy | -13.0379049225199 | 3.654226 | -3.5679 | 0.000883 | 0.000442 |
| Dummy2 | -4.05345478350426 | 2.961919 | -1.3685 | 0.178096 | 0.089048 |
| M1 | 1.34206810010027 | 3.329481 | 0.4031 | 0.688837 | 0.344418 |
| M2 | -2.50509520992201 | 3.503696 | -0.715 | 0.478394 | 0.239197 |
| M3 | -2.00322924642182 | 3.438544 | -0.5826 | 0.563149 | 0.281575 |
| M4 | 1.29920942187024 | 3.383912 | 0.3839 | 0.702874 | 0.351437 |
| M5 | -4.16002535649746 | 3.418004 | -1.2171 | 0.230057 | 0.115029 |
| M6 | 2.07391207534814 | 3.528434 | 0.5878 | 0.559691 | 0.279845 |
| M7 | -4.84303188385203 | 3.589542 | -1.3492 | 0.184173 | 0.092087 |
| M8 | -5.86222199450384 | 3.776293 | -1.5524 | 0.127737 | 0.063868 |
| M9 | -0.999783326211778 | 3.709066 | -0.2696 | 0.788766 | 0.394383 |
| M10 | 1.92234266806906 | 3.21984 | 0.597 | 0.553547 | 0.276773 |
| M11 | 3.83886385409737 | 3.285144 | 1.1686 | 0.248876 | 0.124438 |
| t | -0.0887384210027683 | 0.107547 | -0.8251 | 0.41376 | 0.20688 |
| Multiple Linear Regression - Regression Statistics | |
| Multiple R | 0.800909028923958 |
| R-squared | 0.641455272611917 |
| Adjusted R-squared | 0.519224115547798 |
| F-TEST (value) | 5.24788677469057 |
| F-TEST (DF numerator) | 15 |
| F-TEST (DF denominator) | 44 |
| p-value | 8.11206960560362e-06 |
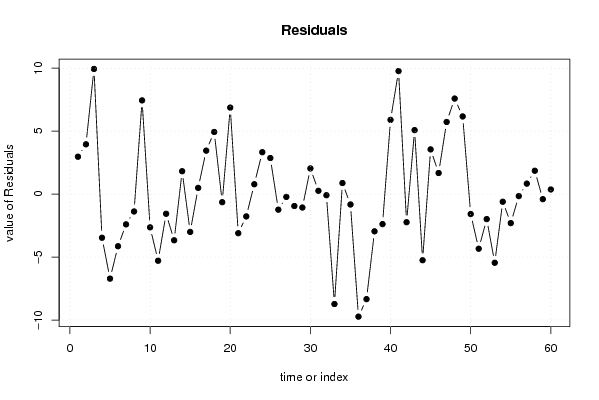
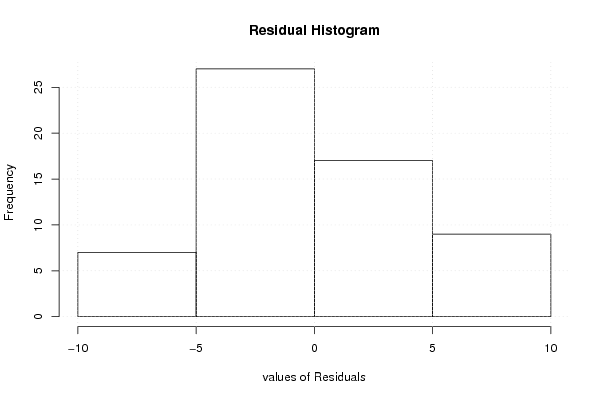
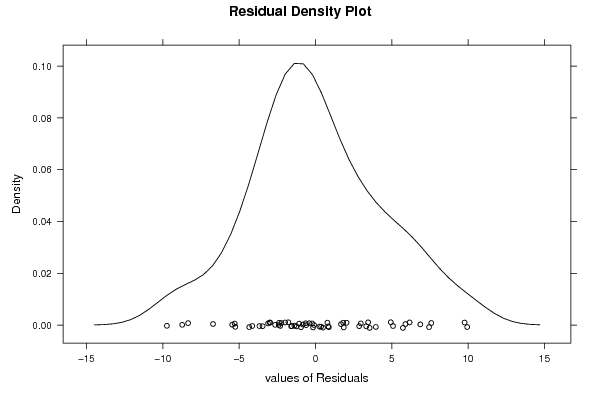
| Multiple Linear Regression - Residual Statistics | |
| Residual Standard Deviation | 5.00485304078557 |
| Sum Squared Residuals | 1102.13637423387 |
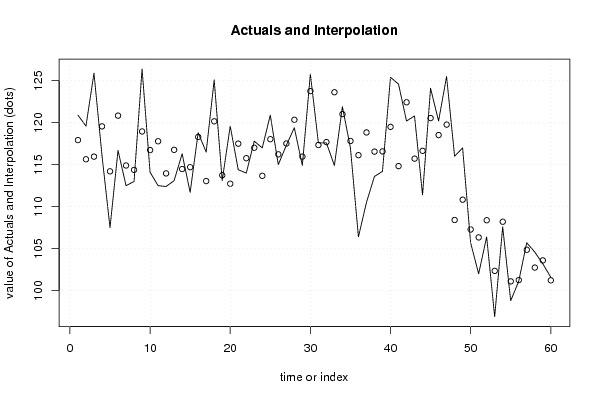
| Multiple Linear Regression - Actuals, Interpolation, and Residuals | |||
| Time or Index | Actuals | Interpolation Forecast | Residuals Prediction Error |
| 1 | 120.9 | 117.928834756359 | 2.97116524364149 |
| 2 | 119.6 | 115.644253118023 | 3.95574688197655 |
| 3 | 125.9 | 115.960244184480 | 9.93975581551975 |
| 4 | 116.1 | 119.562490335932 | -3.4624903359319 |
| 5 | 107.5 | 114.208790088643 | -6.70879008864261 |
| 6 | 116.7 | 120.839671479688 | -4.13967147968837 |
| 7 | 112.5 | 114.902490335932 | -2.40249033593189 |
| 8 | 113 | 114.377380660521 | -1.37738066052084 |
| 9 | 126.4 | 118.956807955729 | 7.44319204427103 |
| 10 | 114.1 | 116.739098774896 | -2.63909877489649 |
| 11 | 112.5 | 117.789789731597 | -5.28978973159734 |
| 12 | 112.4 | 113.959323932538 | -1.55932393253778 |
| 13 | 113.1 | 116.766837228285 | -3.66683722828469 |
| 14 | 116.3 | 114.482255589950 | 1.81774441005038 |
| 15 | 111.7 | 114.701110180366 | -3.00111018036586 |
| 16 | 118.8 | 118.303356331817 | 0.496643668182495 |
| 17 | 116.5 | 113.046792560569 | 3.45320743943121 |
| 18 | 125.1 | 120.163356331817 | 4.9366436681825 |
| 19 | 113.1 | 113.740492807858 | -0.640492807858089 |
| 20 | 119.6 | 112.729700752244 | 6.8702992477559 |
| 21 | 114.4 | 117.503400999533 | -3.10340099953339 |
| 22 | 114 | 115.771374198904 | -1.77137419890386 |
| 23 | 117.8 | 117.016338107686 | 0.783661892314115 |
| 24 | 117 | 113.671554688829 | 3.32844531117074 |
| 25 | 120.9 | 118.033251601226 | 2.86674839877445 |
| 26 | 115 | 116.234352343093 | -1.23435234309343 |
| 27 | 117.3 | 117.521708169956 | -0.221708169956131 |
| 28 | 119.4 | 120.346862513083 | -0.946862513083068 |
| 29 | 114.9 | 115.964527026200 | -1.06452702619964 |
| 30 | 125.8 | 123.761046129732 | 2.03895387026753 |
| 31 | 117.6 | 117.338182605773 | 0.261817394226945 |
| 32 | 117.6 | 117.687301214727 | -0.0873012147272914 |
| 33 | 114.9 | 123.626639174504 | -8.72663917450362 |
| 34 | 121.9 | 121.020384089509 | 0.879615910491202 |
| 35 | 117 | 117.823347310624 | -0.823347310624221 |
| 36 | 106.4 | 116.129883984458 | -9.72988398445757 |
| 37 | 110.5 | 118.840260804164 | -8.34026080416389 |
| 38 | 113.6 | 116.555679165829 | -2.95567916582884 |
| 39 | 114.2 | 116.580260804164 | -2.38026080416390 |
| 40 | 125.4 | 119.502551623331 | 5.89744837666858 |
| 41 | 124.6 | 114.828806708326 | 9.77119329167375 |
| 42 | 120.2 | 122.431052859778 | -2.23105285977788 |
| 43 | 120.8 | 115.716779907697 | 5.08322009230329 |
| 44 | 111.4 | 116.648717372894 | -5.24871737289446 |
| 45 | 124.1 | 120.548189335818 | 3.55181066418152 |
| 46 | 120.2 | 118.524753107067 | 1.67524689293283 |
| 47 | 125.5 | 119.769717015849 | 5.7302829841508 |
| 48 | 116 | 108.411848218383 | 7.58815178161719 |
| 49 | 117 | 110.830815609967 | 6.16918439003264 |
| 50 | 105.7 | 107.283459783105 | -1.58345978310466 |
| 51 | 102 | 106.336676661034 | -4.33667666103386 |
| 52 | 106.4 | 108.384739195836 | -1.9847391958361 |
| 53 | 96.9 | 102.351083616263 | -5.45108361626269 |
| 54 | 107.6 | 108.204873198984 | -0.604873198983777 |
| 55 | 98.8 | 101.102054342740 | -2.30205434274025 |
| 56 | 101.1 | 101.256899999613 | -0.156899999613309 |
| 57 | 105.7 | 104.864962534416 | 0.83503746558445 |
| 58 | 104.6 | 102.744389829624 | 1.85561017037632 |
| 59 | 103.2 | 103.600807834243 | -0.400807834243344 |
| 60 | 101.6 | 101.227389175793 | 0.372610824207394 |
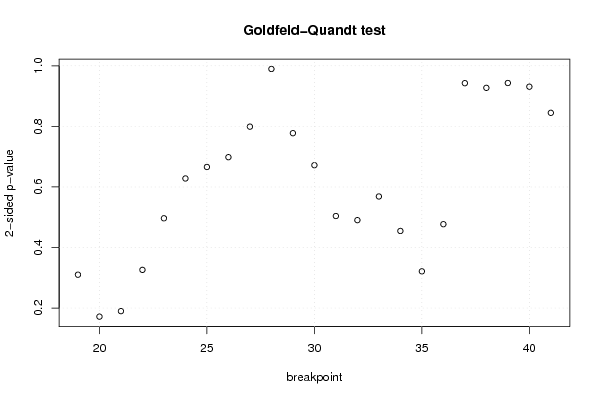
| Goldfeld-Quandt test for Heteroskedasticity | |||
| p-values | Alternative Hypothesis | ||
| breakpoint index | greater | 2-sided | less |
| 19 | 0.844909026701814 | 0.310181946596373 | 0.155090973298186 |
| 20 | 0.914174580542675 | 0.17165083891465 | 0.085825419457325 |
| 21 | 0.905057874753116 | 0.189884250493768 | 0.0949421252468842 |
| 22 | 0.836912612073963 | 0.326174775852073 | 0.163087387926037 |
| 23 | 0.751771517585683 | 0.496456964828633 | 0.248228482414317 |
| 24 | 0.686007238815383 | 0.627985522369234 | 0.313992761184617 |
| 25 | 0.667046504373955 | 0.665906991252091 | 0.332953495626045 |
| 26 | 0.650875055303291 | 0.698249889393417 | 0.349124944696709 |
| 27 | 0.600453018443376 | 0.799093963113249 | 0.399546981556624 |
| 28 | 0.494808241241212 | 0.989616482482423 | 0.505191758758788 |
| 29 | 0.388759290319535 | 0.77751858063907 | 0.611240709680465 |
| 30 | 0.335907825327388 | 0.671815650654777 | 0.664092174672612 |
| 31 | 0.251958801453341 | 0.503917602906682 | 0.748041198546659 |
| 32 | 0.245146679419943 | 0.490293358839887 | 0.754853320580057 |
| 33 | 0.284254890868330 | 0.568509781736661 | 0.71574510913167 |
| 34 | 0.227346837207815 | 0.454693674415629 | 0.772653162792185 |
| 35 | 0.160662875760086 | 0.321325751520172 | 0.839337124239914 |
| 36 | 0.238470784097287 | 0.476941568194574 | 0.761529215902713 |
| 37 | 0.471315022069339 | 0.942630044138679 | 0.528684977930661 |
| 38 | 0.463613696333829 | 0.927227392667658 | 0.536386303666171 |
| 39 | 0.471615495698494 | 0.943230991396988 | 0.528384504301506 |
| 40 | 0.46551750865253 | 0.93103501730506 | 0.53448249134747 |
| 41 | 0.577625026230328 | 0.844749947539343 | 0.422374973769672 |
| Meta Analysis of Goldfeld-Quandt test for Heteroskedasticity | |||
| Description | # significant tests | % significant tests | OK/NOK |
| 1% type I error level | 0 | 0 | OK |
| 5% type I error level | 0 | 0 | OK |
| 10% type I error level | 0 | 0 | OK |