| Multiple Linear Regression - Estimated Regression Equation |
| Y[t] = -0.322809223089442 + 0.0518061441391626X[t] + 0.975170502562991Y1[t] -0.116024070052944Y2[t] + 0.00885828143121708Y3[t] + 0.247106653868723Y4[t] -0.332969323286305Y5[t] -0.688673468306776M1[t] -1.09191559338719M2[t] -0.90814048713177M3[t] -0.371568623488736M4[t] -0.164833511373571M5[t] + 0.185268234324544M6[t] -1.15177125372001M7[t] + 1.4792396079914M8[t] + 0.75528855950583M9[t] + 0.176543249138199M10[t] + 0.611097713715677M11[t] -0.0455753246002475t + e[t] |
| Multiple Linear Regression - Ordinary Least Squares | |||||
| Variable | Parameter | S.D. | T-STAT H0: parameter = 0 | 2-tail p-value | 1-tail p-value |
| (Intercept) | -0.322809223089442 | 1.850837 | -0.1744 | 0.862193 | 0.431097 |
| X | 0.0518061441391626 | 0.019755 | 2.6225 | 0.01132 | 0.00566 |
| Y1 | 0.975170502562991 | 0.12962 | 7.5233 | 0 | 0 |
| Y2 | -0.116024070052944 | 0.188871 | -0.6143 | 0.541594 | 0.270797 |
| Y3 | 0.00885828143121708 | 0.19186 | 0.0462 | 0.963345 | 0.481672 |
| Y4 | 0.247106653868723 | 0.190309 | 1.2984 | 0.199651 | 0.099825 |
| Y5 | -0.332969323286305 | 0.132367 | -2.5155 | 0.014893 | 0.007447 |
| M1 | -0.688673468306776 | 2.086495 | -0.3301 | 0.74263 | 0.371315 |
| M2 | -1.09191559338719 | 2.193078 | -0.4979 | 0.620582 | 0.310291 |
| M3 | -0.90814048713177 | 2.253233 | -0.403 | 0.688511 | 0.344255 |
| M4 | -0.371568623488736 | 2.226363 | -0.1669 | 0.868076 | 0.434038 |
| M5 | -0.164833511373571 | 2.203134 | -0.0748 | 0.940636 | 0.470318 |
| M6 | 0.185268234324544 | 2.19278 | 0.0845 | 0.932979 | 0.46649 |
| M7 | -1.15177125372001 | 2.232651 | -0.5159 | 0.608047 | 0.304023 |
| M8 | 1.4792396079914 | 2.182647 | 0.6777 | 0.500838 | 0.250419 |
| M9 | 0.75528855950583 | 2.181834 | 0.3462 | 0.730559 | 0.36528 |
| M10 | 0.176543249138199 | 2.183237 | 0.0809 | 0.93585 | 0.467925 |
| M11 | 0.611097713715677 | 2.16532 | 0.2822 | 0.778853 | 0.389427 |
| t | -0.0455753246002475 | 0.025781 | -1.7678 | 0.082751 | 0.041376 |
| Multiple Linear Regression - Regression Statistics | |
| Multiple R | 0.961390629342346 |
| R-squared | 0.924271942187273 |
| Adjusted R-squared | 0.899029256249697 |
| F-TEST (value) | 36.6154356344236 |
| F-TEST (DF numerator) | 18 |
| F-TEST (DF denominator) | 54 |
| p-value | 0 |
| Multiple Linear Regression - Residual Statistics | |
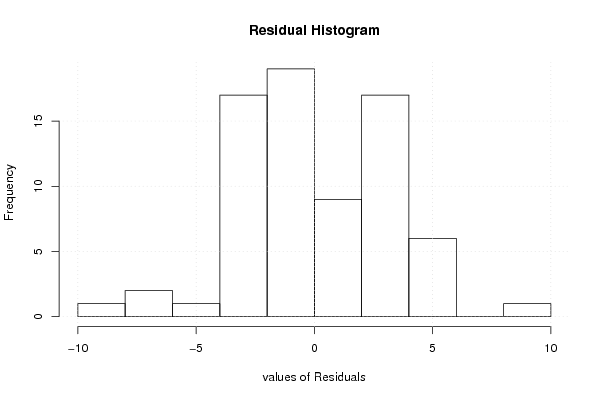
| Residual Standard Deviation | 3.71751652208532 |
| Sum Squared Residuals | 746.276170966775 |
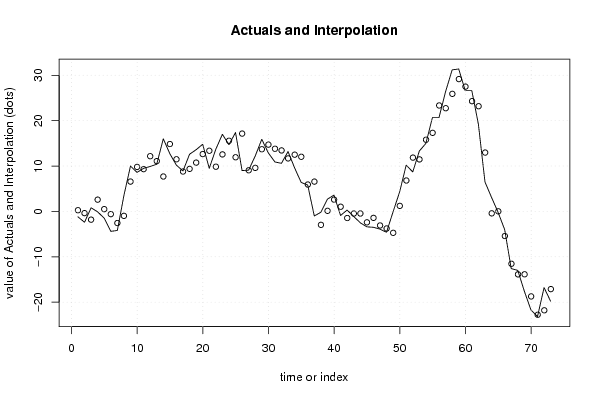
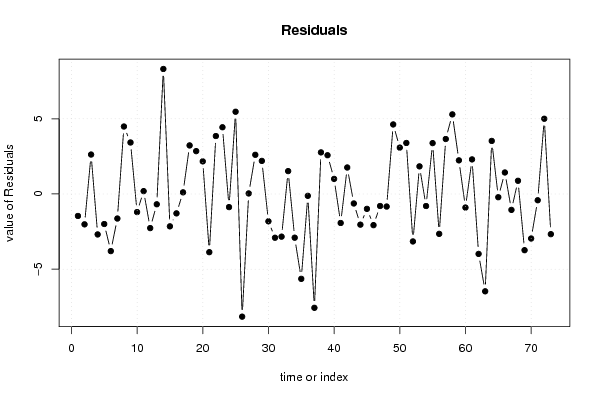
| Multiple Linear Regression - Actuals, Interpolation, and Residuals | |||
| Time or Index | Actuals | Interpolation Forecast | Residuals Prediction Error |
| 1 | -1.2 | 0.261558133992251 | -1.46155813399225 |
| 2 | -2.4 | -0.381597201493626 | -2.01840279850637 |
| 3 | 0.8 | -1.82013639039304 | 2.62013639039304 |
| 4 | -0.1 | 2.5888539611605 | -2.6888539611605 |
| 5 | -1.5 | 0.497074584303551 | -1.99707458430355 |
| 6 | -4.4 | -0.603161017919336 | -3.79683898208066 |
| 7 | -4.2 | -2.56757765486589 | -1.63242234513411 |
| 8 | 3.5 | -0.984065279716556 | 4.48406527971656 |
| 9 | 10 | 6.5770192135762 | 3.4229807864238 |
| 10 | 8.6 | 9.80228117090963 | -1.20228117090963 |
| 11 | 9.5 | 9.31052471969642 | 0.189475280303575 |
| 12 | 9.9 | 12.1678738455548 | -2.26787384555476 |
| 13 | 10.4 | 11.0859393943683 | -0.685939394368294 |
| 14 | 16 | 7.69013503967916 | 8.30986496032084 |
| 15 | 12.7 | 14.8507039344068 | -2.15070393440679 |
| 16 | 10.2 | 11.4899076249712 | -1.28990762497121 |
| 17 | 8.9 | 8.79155241141967 | 0.108447588580332 |
| 18 | 12.6 | 9.3738456129976 | 3.2261543870024 |
| 19 | 13.6 | 10.752389221335 | 2.84761077866499 |
| 20 | 14.8 | 12.6332585827055 | 2.16674141729452 |
| 21 | 9.5 | 13.3686219826737 | -3.86862198267375 |
| 22 | 13.7 | 9.8495271615151 | 3.85047283848491 |
| 23 | 17 | 12.5657729583791 | 4.43422704162089 |
| 24 | 14.7 | 15.571871679197 | -0.871871679197 |
| 25 | 17.4 | 11.9334129051272 | 5.46658709487283 |
| 26 | 9 | 17.1540614889104 | -8.15406148891044 |
| 27 | 9.1 | 9.0648752629318 | 0.0351247370681950 |
| 28 | 12.2 | 9.59607683063916 | 2.60392316936084 |
| 29 | 15.9 | 13.7024602321347 | 2.19753976786525 |
| 30 | 12.9 | 14.7167872690934 | -1.81678726909335 |
| 31 | 10.9 | 13.8076216672225 | -2.90762166722246 |
| 32 | 10.6 | 13.4374264500346 | -2.83742645003463 |
| 33 | 13.2 | 11.6806391626175 | 1.51936083738247 |
| 34 | 9.6 | 12.5058892562393 | -2.90588925623931 |
| 35 | 6.4 | 12.0402404147405 | -5.64024041474054 |
| 36 | 5.8 | 5.9229666190873 | -0.122966619087303 |
| 37 | -1 | 6.56607528306986 | -7.56607528306986 |
| 38 | -0.2 | -2.96358508383517 | 2.76358508383517 |
| 39 | 2.7 | 0.125484203052642 | 2.57451579694736 |
| 40 | 3.6 | 2.59748638922045 | 1.00251361077955 |
| 41 | -0.9 | 1.02855817895485 | -1.92855817895485 |
| 42 | 0.3 | -1.45949197785129 | 1.75949197785129 |
| 43 | -1.1 | -0.468821161505506 | -0.631178838494494 |
| 44 | -2.5 | -0.461044934714281 | -2.03895506528572 |
| 45 | -3.4 | -2.40972974513665 | -0.990270254863347 |
| 46 | -3.5 | -1.42799788986268 | -2.07200211013732 |
| 47 | -3.9 | -3.10072368117839 | -0.799276318821605 |
| 48 | -4.6 | -3.76459650892189 | -0.835403491078113 |
| 49 | -0.1 | -4.72121951396673 | 4.62121951396673 |
| 50 | 4.3 | 1.21830094354682 | 3.08169905645318 |
| 51 | 10.2 | 6.80962438133781 | 3.39037561866219 |
| 52 | 8.7 | 11.8546745982653 | -3.15467459826532 |
| 53 | 13.3 | 11.4649767166010 | 1.83502328339904 |
| 54 | 15 | 15.8011027877226 | -0.801102787722553 |
| 55 | 20.7 | 17.3198171220391 | 3.38018287796087 |
| 56 | 20.7 | 23.3502375632766 | -2.65023756327655 |
| 57 | 26.4 | 22.7468599702349 | 3.65314002976508 |
| 58 | 31.2 | 25.9101816537873 | 5.28981834621268 |
| 59 | 31.4 | 29.1665655348724 | 2.23343446512764 |
| 60 | 26.6 | 27.5024806662695 | -0.902480666269482 |
| 61 | 26.6 | 24.3026897158864 | 2.29731028411364 |
| 62 | 19.2 | 23.1826848131924 | -3.98268481319238 |
| 63 | 6.5 | 12.969448608664 | -6.469448608664 |
| 64 | 3.1 | -0.426999404256631 | 3.52699940425663 |
| 65 | -0.2 | 0.0153778765862193 | -0.215377876586219 |
| 66 | -4 | -5.42908267404288 | 1.42908267404288 |
| 67 | -12.6 | -11.5434291942252 | -1.05657080577479 |
| 68 | -13 | -13.8758123815858 | 0.875812381585828 |
| 69 | -17.6 | -13.8634105839657 | -3.73658941603426 |
| 70 | -21.7 | -18.7398813525887 | -2.96011864741131 |
| 71 | -23.2 | -22.7823799465100 | -0.417620053489954 |
| 72 | -16.8 | -21.8005963011867 | 5.00059630118666 |
| 73 | -19.8 | -17.1284559184772 | -2.67154408152278 |
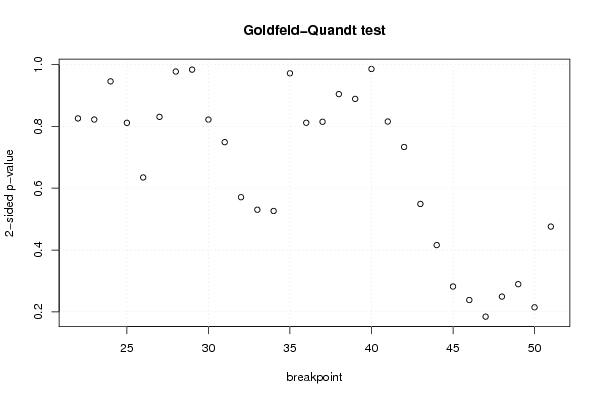
| Goldfeld-Quandt test for Heteroskedasticity | |||
| p-values | Alternative Hypothesis | ||
| breakpoint index | greater | 2-sided | less |
| 22 | 0.41281872233443 | 0.82563744466886 | 0.58718127766557 |
| 23 | 0.589003511730978 | 0.821992976538044 | 0.410996488269022 |
| 24 | 0.472771799639969 | 0.945543599279939 | 0.527228200360031 |
| 25 | 0.405686432115569 | 0.811372864231137 | 0.594313567884431 |
| 26 | 0.682656876175596 | 0.634686247648808 | 0.317343123824404 |
| 27 | 0.584665524406192 | 0.830668951187617 | 0.415334475593808 |
| 28 | 0.488619360190497 | 0.977238720380994 | 0.511380639809503 |
| 29 | 0.491698898654455 | 0.983397797308909 | 0.508301101345545 |
| 30 | 0.410900097767785 | 0.82180019553557 | 0.589099902232215 |
| 31 | 0.374409276003988 | 0.748818552007976 | 0.625590723996012 |
| 32 | 0.285408933027825 | 0.570817866055651 | 0.714591066972175 |
| 33 | 0.265155344813338 | 0.530310689626675 | 0.734844655186662 |
| 34 | 0.263174727617409 | 0.526349455234818 | 0.736825272382591 |
| 35 | 0.485764754635226 | 0.971529509270451 | 0.514235245364774 |
| 36 | 0.405791921564042 | 0.811583843128084 | 0.594208078435958 |
| 37 | 0.592617040845291 | 0.814765918309419 | 0.407382959154709 |
| 38 | 0.54787252006287 | 0.90425495987426 | 0.45212747993713 |
| 39 | 0.55562587711879 | 0.888748245762421 | 0.444374122881211 |
| 40 | 0.507197266568409 | 0.985605466863182 | 0.492802733431591 |
| 41 | 0.407772046516899 | 0.815544093033797 | 0.592227953483101 |
| 42 | 0.366590346051977 | 0.733180692103954 | 0.633409653948023 |
| 43 | 0.274526150371030 | 0.549052300742061 | 0.72547384962897 |
| 44 | 0.208007794480972 | 0.416015588961944 | 0.791992205519028 |
| 45 | 0.141002475930363 | 0.282004951860726 | 0.858997524069637 |
| 46 | 0.119122754566124 | 0.238245509132249 | 0.880877245433876 |
| 47 | 0.0922578946882801 | 0.184515789376560 | 0.90774210531172 |
| 48 | 0.124682750416208 | 0.249365500832416 | 0.875317249583792 |
| 49 | 0.144745458212401 | 0.289490916424802 | 0.855254541787599 |
| 50 | 0.107383262852390 | 0.214766525704780 | 0.89261673714761 |
| 51 | 0.23787297794845 | 0.4757459558969 | 0.76212702205155 |
| Meta Analysis of Goldfeld-Quandt test for Heteroskedasticity | |||
| Description | # significant tests | % significant tests | OK/NOK |
| 1% type I error level | 0 | 0 | OK |
| 5% type I error level | 0 | 0 | OK |
| 10% type I error level | 0 | 0 | OK |