| Multiple Linear Regression - Estimated Regression Equation |
| Y[t] = + 263.734200766228 + 0.000253339919810202X[t] + 1.23877863761127Y1[t] -0.317282826192632Y2[t] + 0.169813272838906Y3[t] -0.0593898141762464Y4[t] + 0.230078665812567Y5[t] -0.455301377384477Y6[t] + 0.133074244597905Y7[t] + 0.144344462501845Y8[t] + 0.0194396382456085Y9[t] -0.264854112662661Y10[t] + 0.55307300684554Y11[t] -0.525001084215331Y12[t] + 47.9017286725281M1[t] + 94.2651699586358M2[t] + 60.4857327806912M3[t] + 121.951904260527M4[t] + 40.5584718885717M5[t] + 228.392489428843M6[t] + 66.902963518707M7[t] -25.7832520296353M8[t] + 39.6934894694768M9[t] + 58.4457634559164M10[t] + 78.4448469281772M11[t] + 3.98110966935865t + e[t] |
| Multiple Linear Regression - Ordinary Least Squares | |||||
| Variable | Parameter | S.D. | T-STAT H0: parameter = 0 | 2-tail p-value | 1-tail p-value |
| (Intercept) | 263.734200766228 | 318.672045 | 0.8276 | 0.413666 | 0.206833 |
| X | 0.000253339919810202 | 0.026648 | 0.0095 | 0.99247 | 0.496235 |
| Y1 | 1.23877863761127 | 0.15515 | 7.9844 | 0 | 0 |
| Y2 | -0.317282826192632 | 0.242012 | -1.311 | 0.198636 | 0.099318 |
| Y3 | 0.169813272838906 | 0.244708 | 0.6939 | 0.492432 | 0.246216 |
| Y4 | -0.0593898141762464 | 0.246685 | -0.2408 | 0.811194 | 0.405597 |
| Y5 | 0.230078665812567 | 0.243412 | 0.9452 | 0.351214 | 0.175607 |
| Y6 | -0.455301377384477 | 0.245696 | -1.8531 | 0.072562 | 0.036281 |
| Y7 | 0.133074244597905 | 0.247521 | 0.5376 | 0.594336 | 0.297168 |
| Y8 | 0.144344462501845 | 0.242146 | 0.5961 | 0.555053 | 0.277527 |
| Y9 | 0.0194396382456085 | 0.246411 | 0.0789 | 0.937582 | 0.468791 |
| Y10 | -0.264854112662661 | 0.244295 | -1.0842 | 0.285924 | 0.142962 |
| Y11 | 0.55307300684554 | 0.248093 | 2.2293 | 0.032507 | 0.016254 |
| Y12 | -0.525001084215331 | 0.191239 | -2.7453 | 0.00959 | 0.004795 |
| M1 | 47.9017286725281 | 118.261871 | 0.405 | 0.68798 | 0.34399 |
| M2 | 94.2651699586358 | 121.023341 | 0.7789 | 0.441426 | 0.220713 |
| M3 | 60.4857327806912 | 123.436782 | 0.49 | 0.627271 | 0.313636 |
| M4 | 121.951904260527 | 123.801433 | 0.9851 | 0.331553 | 0.165776 |
| M5 | 40.5584718885717 | 122.992699 | 0.3298 | 0.743602 | 0.371801 |
| M6 | 228.392489428843 | 125.422446 | 1.821 | 0.077419 | 0.03871 |
| M7 | 66.902963518707 | 120.687384 | 0.5543 | 0.582968 | 0.291484 |
| M8 | -25.7832520296353 | 113.91537 | -0.2263 | 0.822295 | 0.411147 |
| M9 | 39.6934894694768 | 117.451843 | 0.338 | 0.737475 | 0.368737 |
| M10 | 58.4457634559164 | 121.293747 | 0.4819 | 0.632998 | 0.316499 |
| M11 | 78.4448469281772 | 115.395537 | 0.6798 | 0.501239 | 0.25062 |
| t | 3.98110966935865 | 6.649876 | 0.5987 | 0.553358 | 0.276679 |
| Multiple Linear Regression - Regression Statistics | |
| Multiple R | 0.988781225067778 |
| R-squared | 0.977688311046536 |
| Adjusted R-squared | 0.961282657404283 |
| F-TEST (value) | 59.5945966168931 |
| F-TEST (DF numerator) | 25 |
| F-TEST (DF denominator) | 34 |
| p-value | 0 |
| Multiple Linear Regression - Residual Statistics | |
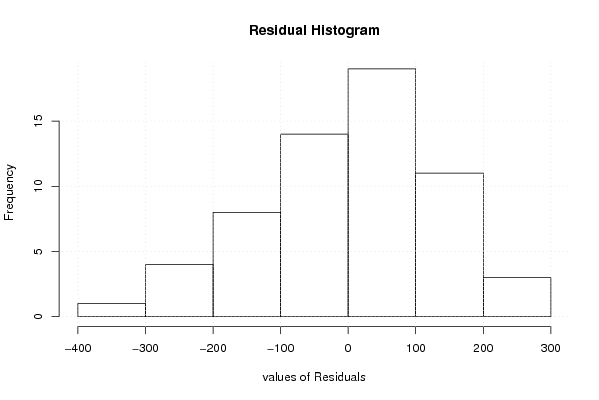
| Residual Standard Deviation | 167.808885383951 |
| Sum Squared Residuals | 957433.948469338 |
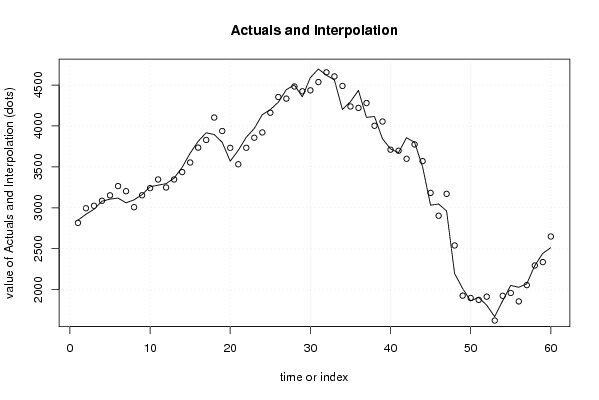
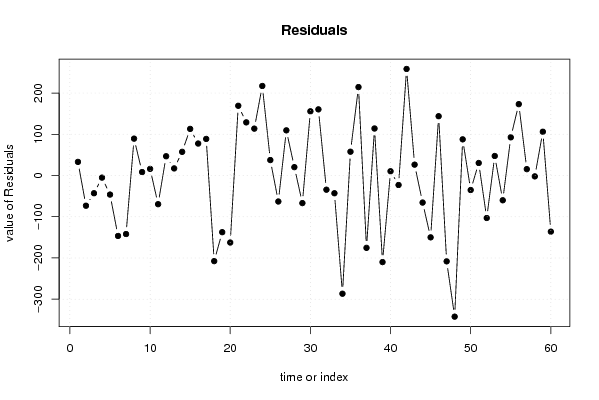
| Multiple Linear Regression - Actuals, Interpolation, and Residuals | |||
| Time or Index | Actuals | Interpolation Forecast | Residuals Prediction Error |
| 1 | 2849.27 | 2816.27508428207 | 32.9949157179337 |
| 2 | 2921.44 | 2994.6896361064 | -73.2496361063972 |
| 3 | 2981.85 | 3024.85793243141 | -43.0079324314072 |
| 4 | 3080.58 | 3085.71836399457 | -5.13836399457217 |
| 5 | 3106.22 | 3152.44982234285 | -46.2298223428475 |
| 6 | 3119.31 | 3265.90736121444 | -146.597361214440 |
| 7 | 3061.26 | 3203.22651156427 | -141.966511564271 |
| 8 | 3097.31 | 3007.86951229216 | 89.4404877078393 |
| 9 | 3161.69 | 3153.27157074454 | 8.41842925545732 |
| 10 | 3257.16 | 3241.08683008212 | 16.0731699178766 |
| 11 | 3277.01 | 3346.56555055549 | -69.5555505554946 |
| 12 | 3295.32 | 3248.58037234679 | 46.7396276532099 |
| 13 | 3363.99 | 3346.7858985894 | 17.2041014106021 |
| 14 | 3494.17 | 3436.72119326856 | 57.4488067314444 |
| 15 | 3667.03 | 3553.93972106815 | 113.090278931848 |
| 16 | 3813.06 | 3735.51249197224 | 77.5475080277635 |
| 17 | 3917.96 | 3829.19687812337 | 88.7631218766249 |
| 18 | 3895.51 | 4103.14352127401 | -207.633521274014 |
| 19 | 3801.06 | 3938.5486635358 | -137.488663535800 |
| 20 | 3570.12 | 3732.68652617856 | -162.566526178561 |
| 21 | 3701.61 | 3532.4409747153 | 169.169025284701 |
| 22 | 3862.27 | 3733.35929508236 | 128.910704917641 |
| 23 | 3970.1 | 3856.36344203787 | 113.736557962129 |
| 24 | 4138.52 | 3921.27749320525 | 217.242506794749 |
| 25 | 4199.75 | 4162.25804757055 | 37.4919524294548 |
| 26 | 4290.89 | 4353.91182206719 | -63.021822067185 |
| 27 | 4443.91 | 4334.37922231134 | 109.530777688664 |
| 28 | 4502.64 | 4482.3423429824 | 20.2976570176018 |
| 29 | 4356.98 | 4423.91805323185 | -66.9380532318512 |
| 30 | 4591.27 | 4435.50795617548 | 155.762043824521 |
| 31 | 4696.96 | 4536.49989715262 | 160.460102847375 |
| 32 | 4621.4 | 4655.78653367334 | -34.3865336733385 |
| 33 | 4562.84 | 4605.86279664817 | -43.0227966481657 |
| 34 | 4202.52 | 4489.22308052641 | -286.703080526411 |
| 35 | 4296.49 | 4238.72967804291 | 57.7603219570854 |
| 36 | 4435.23 | 4220.70906782703 | 214.520932172969 |
| 37 | 4105.18 | 4280.62612881557 | -175.446128815567 |
| 38 | 4116.68 | 4002.66949525508 | 114.010504744920 |
| 39 | 3844.49 | 4054.47376382167 | -209.983763821667 |
| 40 | 3720.98 | 3710.57670651112 | 10.4032934888799 |
| 41 | 3674.4 | 3697.39253654014 | -22.9925365401388 |
| 42 | 3857.62 | 3599.11699593431 | 258.503004065688 |
| 43 | 3801.06 | 3774.68478380079 | 26.3752161992075 |
| 44 | 3504.37 | 3569.97868720109 | -65.6086872010924 |
| 45 | 3032.6 | 3182.59820690516 | -149.998206905158 |
| 46 | 3047.03 | 2903.21761383401 | 143.812386165994 |
| 47 | 2962.34 | 3170.51292384835 | -208.172923848345 |
| 48 | 2197.82 | 2540.18267213309 | -342.362672133095 |
| 49 | 2014.45 | 1926.69484074242 | 87.7551592575769 |
| 50 | 1862.83 | 1898.01785330278 | -35.1878533027819 |
| 51 | 1905.41 | 1875.03936036744 | 30.3706396325610 |
| 52 | 1810.99 | 1914.10009453967 | -103.110094539673 |
| 53 | 1670.07 | 1622.67270976179 | 47.3972902382125 |
| 54 | 1864.44 | 1924.47416540175 | -60.0341654017546 |
| 55 | 2052.02 | 1959.40014394651 | 92.6198560534883 |
| 56 | 2029.6 | 1856.47874065485 | 173.121259345153 |
| 57 | 2070.83 | 2055.39645098683 | 15.4335490131661 |
| 58 | 2293.41 | 2295.5031804751 | -2.09318047510133 |
| 59 | 2443.27 | 2337.03840551537 | 106.231594484625 |
| 60 | 2513.17 | 2649.31039448783 | -136.140394487834 |
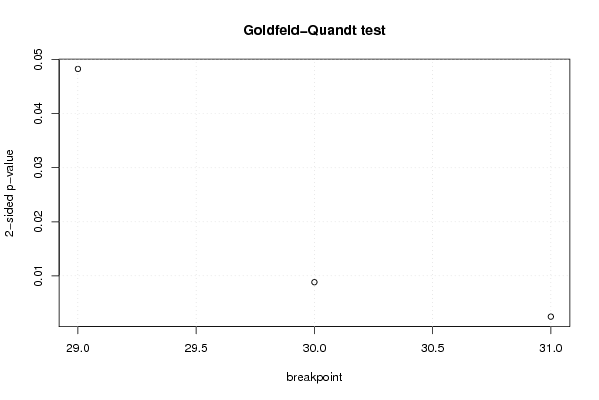
| Goldfeld-Quandt test for Heteroskedasticity | |||
| p-values | Alternative Hypothesis | ||
| breakpoint index | greater | 2-sided | less |
| 29 | 0.0241374538447278 | 0.0482749076894557 | 0.975862546155272 |
| 30 | 0.00440780505639465 | 0.0088156101127893 | 0.995592194943605 |
| 31 | 0.00122077032687833 | 0.00244154065375667 | 0.998779229673122 |
| Meta Analysis of Goldfeld-Quandt test for Heteroskedasticity | |||
| Description | # significant tests | % significant tests | OK/NOK |
| 1% type I error level | 2 | 0.666666666666667 | NOK |
| 5% type I error level | 3 | 1 | NOK |
| 10% type I error level | 3 | 1 | NOK |