| Multiple Linear Regression - Estimated Regression Equation |
| Y[t] = + 129.718988349067 + 0.0136271957734372X[t] + 1.19580953439251Y1[t] -0.238594808848829Y2[t] + 0.196588623192844Y3[t] -0.145134629903214Y4[t] + 0.185141696854423Y5[t] -0.287136374322501Y6[t] -0.0474422047632084Y7[t] + 0.214776602993101Y8[t] -0.136153330812813Y9[t] -97.833027155869M1[t] -45.5330062332913M2[t] -21.5011093797021M3[t] -32.1109665268857M4[t] -35.3444354143223M5[t] -68.1801106941438M6[t] + 91.203578826176M7[t] -75.5180147630598M8[t] -152.121790143776M9[t] -78.3595862713242M10[t] + 2.82383943069867M11[t] -3.29251587550166t + e[t] |
| Multiple Linear Regression - Ordinary Least Squares | |||||
| Variable | Parameter | S.D. | T-STAT H0: parameter = 0 | 2-tail p-value | 1-tail p-value |
| (Intercept) | 129.718988349067 | 320.680286 | 0.4045 | 0.688165 | 0.344083 |
| X | 0.0136271957734372 | 0.027698 | 0.492 | 0.625632 | 0.312816 |
| Y1 | 1.19580953439251 | 0.163169 | 7.3287 | 0 | 0 |
| Y2 | -0.238594808848829 | 0.254168 | -0.9387 | 0.353957 | 0.176979 |
| Y3 | 0.196588623192844 | 0.258008 | 0.7619 | 0.450921 | 0.22546 |
| Y4 | -0.145134629903214 | 0.254971 | -0.5692 | 0.572646 | 0.286323 |
| Y5 | 0.185141696854423 | 0.250831 | 0.7381 | 0.465101 | 0.232551 |
| Y6 | -0.287136374322501 | 0.252906 | -1.1353 | 0.26353 | 0.131765 |
| Y7 | -0.0474422047632084 | 0.256306 | -0.1851 | 0.854162 | 0.427081 |
| Y8 | 0.214776602993101 | 0.258388 | 0.8312 | 0.411183 | 0.205591 |
| Y9 | -0.136153330812813 | 0.187124 | -0.7276 | 0.471431 | 0.235715 |
| M1 | -97.833027155869 | 124.418642 | -0.7863 | 0.436687 | 0.218343 |
| M2 | -45.5330062332913 | 128.719832 | -0.3537 | 0.725544 | 0.362772 |
| M3 | -21.5011093797021 | 127.642071 | -0.1684 | 0.867148 | 0.433574 |
| M4 | -32.1109665268857 | 130.136862 | -0.2467 | 0.806467 | 0.403234 |
| M5 | -35.3444354143223 | 127.303352 | -0.2776 | 0.782835 | 0.391417 |
| M6 | -68.1801106941438 | 127.352612 | -0.5354 | 0.595601 | 0.297801 |
| M7 | 91.203578826176 | 123.383721 | 0.7392 | 0.464458 | 0.232229 |
| M8 | -75.5180147630598 | 119.309677 | -0.633 | 0.530654 | 0.265327 |
| M9 | -152.121790143776 | 122.893405 | -1.2378 | 0.223575 | 0.111787 |
| M10 | -78.3595862713242 | 126.196005 | -0.6209 | 0.538449 | 0.269224 |
| M11 | 2.82383943069867 | 121.091353 | 0.0233 | 0.98152 | 0.49076 |
| t | -3.29251587550166 | 6.159006 | -0.5346 | 0.596135 | 0.298067 |
| Multiple Linear Regression - Regression Statistics | |
| Multiple R | 0.985935806623163 |
| R-squared | 0.972069414781667 |
| Adjusted R-squared | 0.955462039786983 |
| F-TEST (value) | 58.5323938968557 |
| F-TEST (DF numerator) | 22 |
| F-TEST (DF denominator) | 37 |
| p-value | 0 |
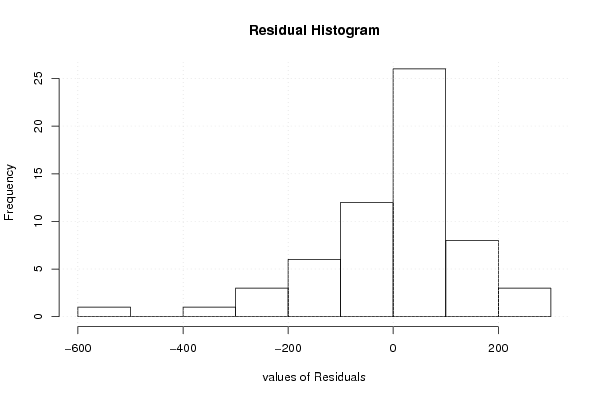
| Multiple Linear Regression - Residual Statistics | |
| Residual Standard Deviation | 179.230088334974 |
| Sum Squared Residuals | 1188566.70888882 |
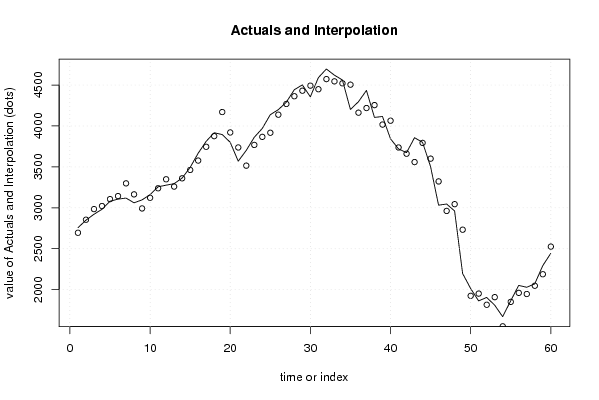
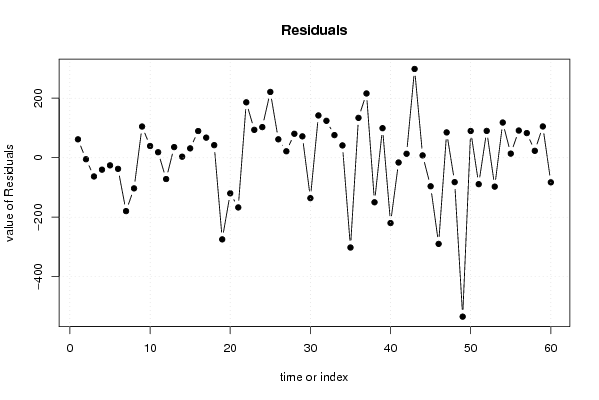
| Multiple Linear Regression - Actuals, Interpolation, and Residuals | |||
| Time or Index | Actuals | Interpolation Forecast | Residuals Prediction Error |
| 1 | 2756.76 | 2694.99724081164 | 61.7627591883607 |
| 2 | 2849.27 | 2854.36269349885 | -5.09269349885296 |
| 3 | 2921.44 | 2984.53477025541 | -63.094770255414 |
| 4 | 2981.85 | 3022.15013511431 | -40.3001351143129 |
| 5 | 3080.58 | 3106.32647221096 | -25.7464722109604 |
| 6 | 3106.22 | 3143.7939178847 | -37.5739178846978 |
| 7 | 3119.31 | 3298.95101900772 | -179.641019007723 |
| 8 | 3061.26 | 3164.47722173451 | -103.217221734515 |
| 9 | 3097.31 | 2992.47239411682 | 104.837605883177 |
| 10 | 3161.69 | 3122.43324606821 | 39.2567539317895 |
| 11 | 3257.16 | 3238.82495849518 | 18.3350415048225 |
| 12 | 3277.01 | 3348.8623081975 | -71.8523081974984 |
| 13 | 3295.32 | 3259.60420117132 | 35.7157988286754 |
| 14 | 3363.99 | 3360.62432010985 | 3.36567989014842 |
| 15 | 3494.17 | 3462.77528969113 | 31.3947103088707 |
| 16 | 3667.03 | 3577.38075401742 | 89.649245982579 |
| 17 | 3813.06 | 3745.58545629987 | 67.4745437001274 |
| 18 | 3917.96 | 3875.7921470718 | 42.1678529282009 |
| 19 | 3895.51 | 4170.2552809412 | -274.745280941203 |
| 20 | 3801.06 | 3920.92953489374 | -119.869534893738 |
| 21 | 3570.12 | 3737.48905010517 | -167.369050105171 |
| 22 | 3701.61 | 3515.30195230011 | 186.308047699893 |
| 23 | 3862.27 | 3768.55507720033 | 93.7149227996692 |
| 24 | 3970.1 | 3867.19548366755 | 102.904516332445 |
| 25 | 4138.52 | 3917.31679772707 | 221.203202272926 |
| 26 | 4199.75 | 4137.89699321978 | 61.8530067802159 |
| 27 | 4290.89 | 4269.31858062881 | 21.5714193711878 |
| 28 | 4443.91 | 4363.44862879933 | 80.4613712006736 |
| 29 | 4502.64 | 4430.88351008449 | 71.7564899155094 |
| 30 | 4356.98 | 4493.099148005 | -136.119148005004 |
| 31 | 4591.27 | 4449.1259214508 | 142.1440785492 |
| 32 | 4696.96 | 4572.90360947257 | 124.056390527433 |
| 33 | 4621.4 | 4545.45870708939 | 75.941292910611 |
| 34 | 4562.84 | 4521.59952920488 | 41.2404707951171 |
| 35 | 4202.52 | 4504.70165455865 | -302.181654558650 |
| 36 | 4296.49 | 4162.45531168665 | 134.034688313352 |
| 37 | 4435.23 | 4219.15759654057 | 216.072403459430 |
| 38 | 4105.18 | 4255.25033673187 | -150.070336731873 |
| 39 | 4116.68 | 4017.44179023862 | 99.2382097613795 |
| 40 | 3844.49 | 4064.4403117008 | -219.950311700802 |
| 41 | 3720.98 | 3737.13634150576 | -16.1563415057587 |
| 42 | 3674.4 | 3661.16060013745 | 13.2393998625486 |
| 43 | 3857.62 | 3559.07598778486 | 298.544012215144 |
| 44 | 3801.06 | 3793.37170559368 | 7.68829440631748 |
| 45 | 3504.37 | 3600.58445965303 | -96.2144596530258 |
| 46 | 3032.6 | 3322.53367218556 | -289.933672185561 |
| 47 | 3047.03 | 2962.02192431968 | 85.0080756803184 |
| 48 | 2962.34 | 3044.55733776145 | -82.2173377614527 |
| 49 | 2197.82 | 2732.57416374939 | -534.754163749392 |
| 50 | 2014.45 | 1924.50565643964 | 89.9443435603621 |
| 51 | 1862.83 | 1951.93956918602 | -89.1095691860238 |
| 52 | 1905.41 | 1815.27017036814 | 90.139829631862 |
| 53 | 1810.99 | 1908.31821989892 | -97.3282198989177 |
| 54 | 1670.07 | 1551.78418690105 | 118.285813098952 |
| 55 | 1864.44 | 1850.74179081542 | 13.6982091845815 |
| 56 | 2052.02 | 1960.67792830550 | 91.3420716945026 |
| 57 | 2029.6 | 1946.79538903559 | 82.804610964409 |
| 58 | 2070.83 | 2047.70160024124 | 23.1283997587616 |
| 59 | 2293.41 | 2188.28638542616 | 105.12361457384 |
| 60 | 2443.27 | 2526.13955868685 | -82.8695586868457 |
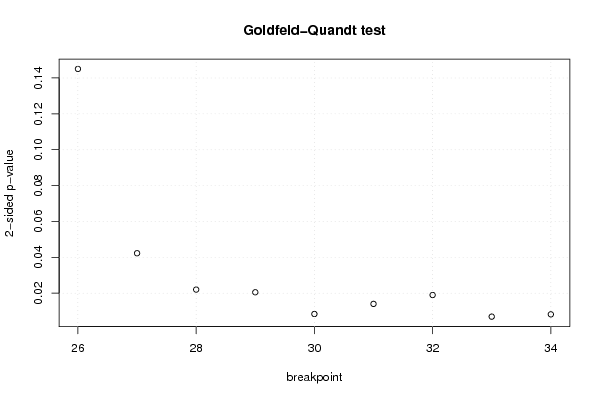
| Goldfeld-Quandt test for Heteroskedasticity | |||
| p-values | Alternative Hypothesis | ||
| breakpoint index | greater | 2-sided | less |
| 26 | 0.0725081383075598 | 0.145016276615120 | 0.92749186169244 |
| 27 | 0.0211506686709099 | 0.0423013373418198 | 0.97884933132909 |
| 28 | 0.0110215265847632 | 0.0220430531695265 | 0.988978473415237 |
| 29 | 0.010270172445703 | 0.020540344891406 | 0.989729827554297 |
| 30 | 0.00421912252619449 | 0.00843824505238899 | 0.995780877473806 |
| 31 | 0.00703012579914803 | 0.0140602515982961 | 0.992969874200852 |
| 32 | 0.00950411593953977 | 0.0190082318790795 | 0.99049588406046 |
| 33 | 0.0034766880795137 | 0.0069533761590274 | 0.996523311920486 |
| 34 | 0.00411976933283398 | 0.00823953866566796 | 0.995880230667166 |
| Meta Analysis of Goldfeld-Quandt test for Heteroskedasticity | |||
| Description | # significant tests | % significant tests | OK/NOK |
| 1% type I error level | 3 | 0.333333333333333 | NOK |
| 5% type I error level | 8 | 0.888888888888889 | NOK |
| 10% type I error level | 8 | 0.888888888888889 | NOK |