| Multiple Linear Regression - Estimated Regression Equation |
| Y[t] = + 1424.56447367454 + 5.91539952569404X[t] + 536.156276110696M1[t] -514.54657119362M2[t] -347.743530055286M3[t] -211.157409011813M4[t] + 146.687268996102M5[t] -452.457215177790M6[t] + 37.7197824506796M7[t] -119.227742861547M8[t] -145.841621818074M9[t] + 350.088401897224M10[t] -254.027094545481M11[t] + e[t] |
| Multiple Linear Regression - Ordinary Least Squares | |||||
| Variable | Parameter | S.D. | T-STAT H0: parameter = 0 | 2-tail p-value | 1-tail p-value |
| (Intercept) | 1424.56447367454 | 1124.391372 | 1.267 | 0.211833 | 0.105917 |
| X | 5.91539952569404 | 1.891514 | 3.1273 | 0.003124 | 0.001562 |
| M1 | 536.156276110696 | 363.057194 | 1.4768 | 0.146856 | 0.073428 |
| M2 | -514.54657119362 | 365.462253 | -1.4079 | 0.166177 | 0.083089 |
| M3 | -347.743530055286 | 364.93557 | -0.9529 | 0.345851 | 0.172926 |
| M4 | -211.157409011813 | 364.50178 | -0.5793 | 0.565338 | 0.282669 |
| M5 | 146.687268996102 | 365.370608 | 0.4015 | 0.690014 | 0.345007 |
| M6 | -452.457215177790 | 367.741275 | -1.2304 | 0.225097 | 0.112548 |
| M7 | 37.7197824506796 | 369.415748 | 0.1021 | 0.919136 | 0.459568 |
| M8 | -119.227742861547 | 374.008152 | -0.3188 | 0.751399 | 0.375699 |
| M9 | -145.841621818074 | 373.015589 | -0.391 | 0.697699 | 0.348849 |
| M10 | 350.088401897224 | 382.421341 | 0.9155 | 0.364944 | 0.182472 |
| M11 | -254.027094545481 | 382.964755 | -0.6633 | 0.510588 | 0.255294 |
| Multiple Linear Regression - Regression Statistics | |
| Multiple R | 0.657806268854861 |
| R-squared | 0.432709087344753 |
| Adjusted R-squared | 0.277993383893322 |
| F-TEST (value) | 2.79680134396048 |
| F-TEST (DF numerator) | 12 |
| F-TEST (DF denominator) | 44 |
| p-value | 0.0063779180725756 |
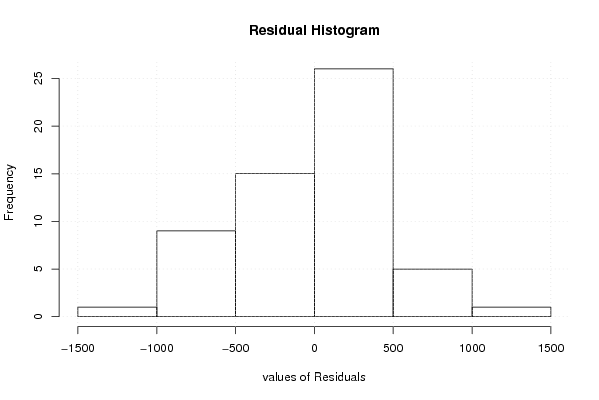
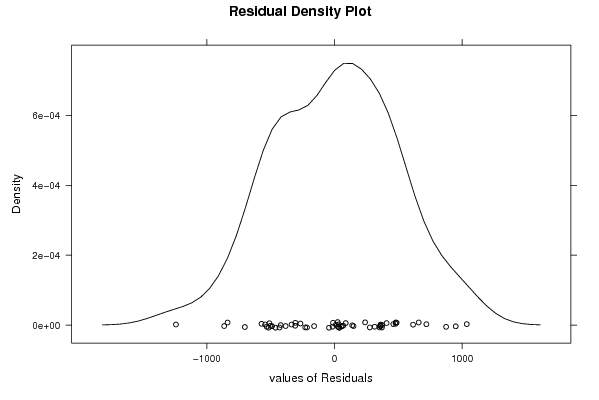
| Multiple Linear Regression - Residual Statistics | |
| Residual Standard Deviation | 540.71958819666 |
| Sum Squared Residuals | 12864617.6146209 |
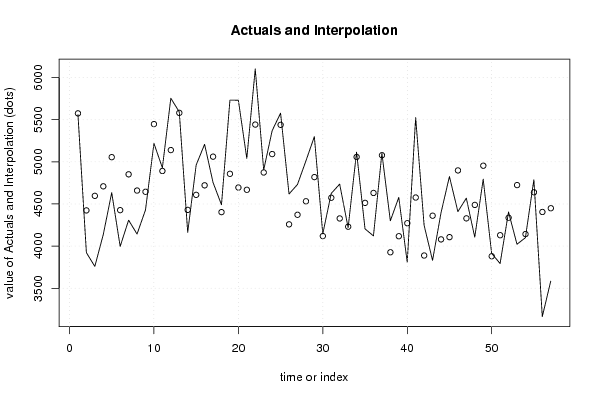
| Multiple Linear Regression - Actuals, Interpolation, and Residuals | |||
| Time or Index | Actuals | Interpolation Forecast | Residuals Prediction Error |
| 1 | 5560 | 5575.02985998427 | -15.0298599842679 |
| 2 | 3922 | 4423.76522074318 | -501.765220743178 |
| 3 | 3759 | 4596.48366140721 | -837.483661407206 |
| 4 | 4138 | 4709.4081843479 | -571.408184347904 |
| 5 | 4634 | 5055.42206330443 | -421.42206330443 |
| 6 | 3996 | 4426.70058150207 | -430.700581502068 |
| 7 | 4308 | 4851.8081843479 | -543.808184347903 |
| 8 | 4143 | 4659.36826188151 | -516.368261881512 |
| 9 | 4429 | 4644.58518197637 | -215.585181976373 |
| 10 | 5219 | 5448.11598102776 | -229.115981027762 |
| 11 | 4929 | 4891.32368079061 | 37.6763192093915 |
| 12 | 5755 | 5139.43537581040 | 615.564624189605 |
| 13 | 5592 | 5580.94525950999 | 11.0547404900125 |
| 14 | 4163 | 4429.68062026887 | -266.680620268872 |
| 15 | 4962 | 4608.31446045859 | 353.685539541405 |
| 16 | 5208 | 4721.23898339929 | 486.761016600709 |
| 17 | 4755 | 5061.33746283012 | -306.337462830124 |
| 18 | 4491 | 4403.03898339929 | 87.9610166007085 |
| 19 | 5732 | 4857.7235838736 | 874.276416126403 |
| 20 | 5731 | 4694.86065903568 | 1036.13934096432 |
| 21 | 5040 | 4668.24678007915 | 371.753219920850 |
| 22 | 6102 | 5442.20058150207 | 659.799418497933 |
| 23 | 4904 | 4873.57748221353 | 30.4225177864735 |
| 24 | 5369 | 5092.11217960484 | 276.887820395157 |
| 25 | 5578 | 5438.97567089333 | 139.024329106669 |
| 26 | 4619 | 4258.13403402374 | 360.865965976255 |
| 27 | 4731 | 4371.69847943083 | 359.301520569167 |
| 28 | 5011 | 4531.94619857708 | 479.053801422918 |
| 29 | 5299 | 4818.80608227667 | 480.193917723331 |
| 30 | 4146 | 4119.09980616598 | 26.9001938340225 |
| 31 | 4625 | 4573.78440664028 | 51.2155933597165 |
| 32 | 4736 | 4328.10588844265 | 407.894111557354 |
| 33 | 4219 | 4230.50721517779 | -11.5072151777908 |
| 34 | 5116 | 5057.69961233195 | 58.3003876680452 |
| 35 | 4205 | 4512.73811114619 | -307.73811114619 |
| 36 | 4121 | 4630.71101660071 | -509.711016600708 |
| 37 | 5103 | 5078.136299826 | 24.8637001740056 |
| 38 | 4300 | 3926.87166058488 | 373.128339415121 |
| 39 | 4578 | 4117.33629982599 | 460.663700174010 |
| 40 | 3809 | 4271.66861944654 | -462.668619446545 |
| 41 | 5526 | 4576.27470172321 | 949.725298276787 |
| 42 | 4247 | 3888.39922466391 | 358.60077533609 |
| 43 | 3830 | 4360.8300237153 | -530.830023715298 |
| 44 | 4394 | 4079.6591083635 | 314.340891636503 |
| 45 | 4826 | 4106.28382513822 | 719.716174861784 |
| 46 | 4409 | 4897.98382513822 | -488.983825138216 |
| 47 | 4569 | 4329.36072584967 | 239.639274150325 |
| 48 | 4106 | 4488.74142798405 | -382.741427984052 |
| 49 | 4794 | 4953.91290978642 | -159.912909786420 |
| 50 | 3914 | 3879.54846437933 | 34.4515356206733 |
| 51 | 3793 | 4129.16709887738 | -336.167098877378 |
| 52 | 4405 | 4336.73801422918 | 68.261985770821 |
| 53 | 4022 | 4724.15968986556 | -702.159689865564 |
| 54 | 4100 | 4142.76140426875 | -42.7614042687536 |
| 55 | 4788 | 4638.85380142292 | 149.146198577082 |
| 56 | 3163 | 4405.00608227667 | -1242.00608227667 |
| 57 | 3585 | 4449.37699762847 | -864.37699762847 |
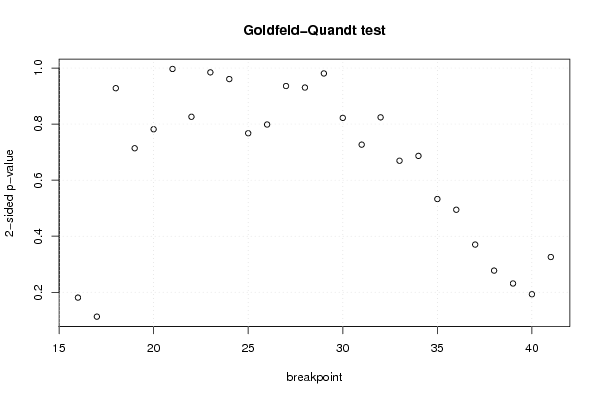
| Goldfeld-Quandt test for Heteroskedasticity | |||
| p-values | Alternative Hypothesis | ||
| breakpoint index | greater | 2-sided | less |
| 16 | 0.0905251533777133 | 0.181050306755427 | 0.909474846622287 |
| 17 | 0.0565295913770162 | 0.113059182754032 | 0.943470408622984 |
| 18 | 0.464094009581645 | 0.928188019163291 | 0.535905990418355 |
| 19 | 0.643042599014843 | 0.713914801970315 | 0.356957400985157 |
| 20 | 0.609141615290843 | 0.781716769418314 | 0.390858384709157 |
| 21 | 0.501580586072251 | 0.996838827855498 | 0.498419413927749 |
| 22 | 0.586891743753183 | 0.826216512493634 | 0.413108256246817 |
| 23 | 0.507672294366112 | 0.984655411267775 | 0.492327705633888 |
| 24 | 0.519643508416608 | 0.960712983166785 | 0.480356491583392 |
| 25 | 0.61627924795043 | 0.76744150409914 | 0.38372075204957 |
| 26 | 0.600693183576881 | 0.798613632846237 | 0.399306816423119 |
| 27 | 0.532046342481981 | 0.935907315036038 | 0.467953657518019 |
| 28 | 0.534762357713258 | 0.930475284573484 | 0.465237642286742 |
| 29 | 0.490406116323515 | 0.98081223264703 | 0.509593883676485 |
| 30 | 0.411124190739981 | 0.822248381479962 | 0.588875809260019 |
| 31 | 0.363366163780696 | 0.726732327561393 | 0.636633836219304 |
| 32 | 0.41209663968194 | 0.82419327936388 | 0.58790336031806 |
| 33 | 0.33468948058876 | 0.66937896117752 | 0.66531051941124 |
| 34 | 0.343316095227004 | 0.686632190454008 | 0.656683904772996 |
| 35 | 0.266372937944738 | 0.532745875889476 | 0.733627062055262 |
| 36 | 0.247232338671353 | 0.494464677342706 | 0.752767661328647 |
| 37 | 0.185123906228969 | 0.370247812457938 | 0.814876093771031 |
| 38 | 0.138684304745095 | 0.277368609490190 | 0.861315695254905 |
| 39 | 0.115697545750973 | 0.231395091501947 | 0.884302454249027 |
| 40 | 0.09652638500818 | 0.19305277001636 | 0.90347361499182 |
| 41 | 0.162902287334478 | 0.325804574668957 | 0.837097712665521 |
| Meta Analysis of Goldfeld-Quandt test for Heteroskedasticity | |||
| Description | # significant tests | % significant tests | OK/NOK |
| 1% type I error level | 0 | 0 | OK |
| 5% type I error level | 0 | 0 | OK |
| 10% type I error level | 0 | 0 | OK |